3 Unit 3: Renewable Energy
This unit provides an overview of non-renewable Energy.
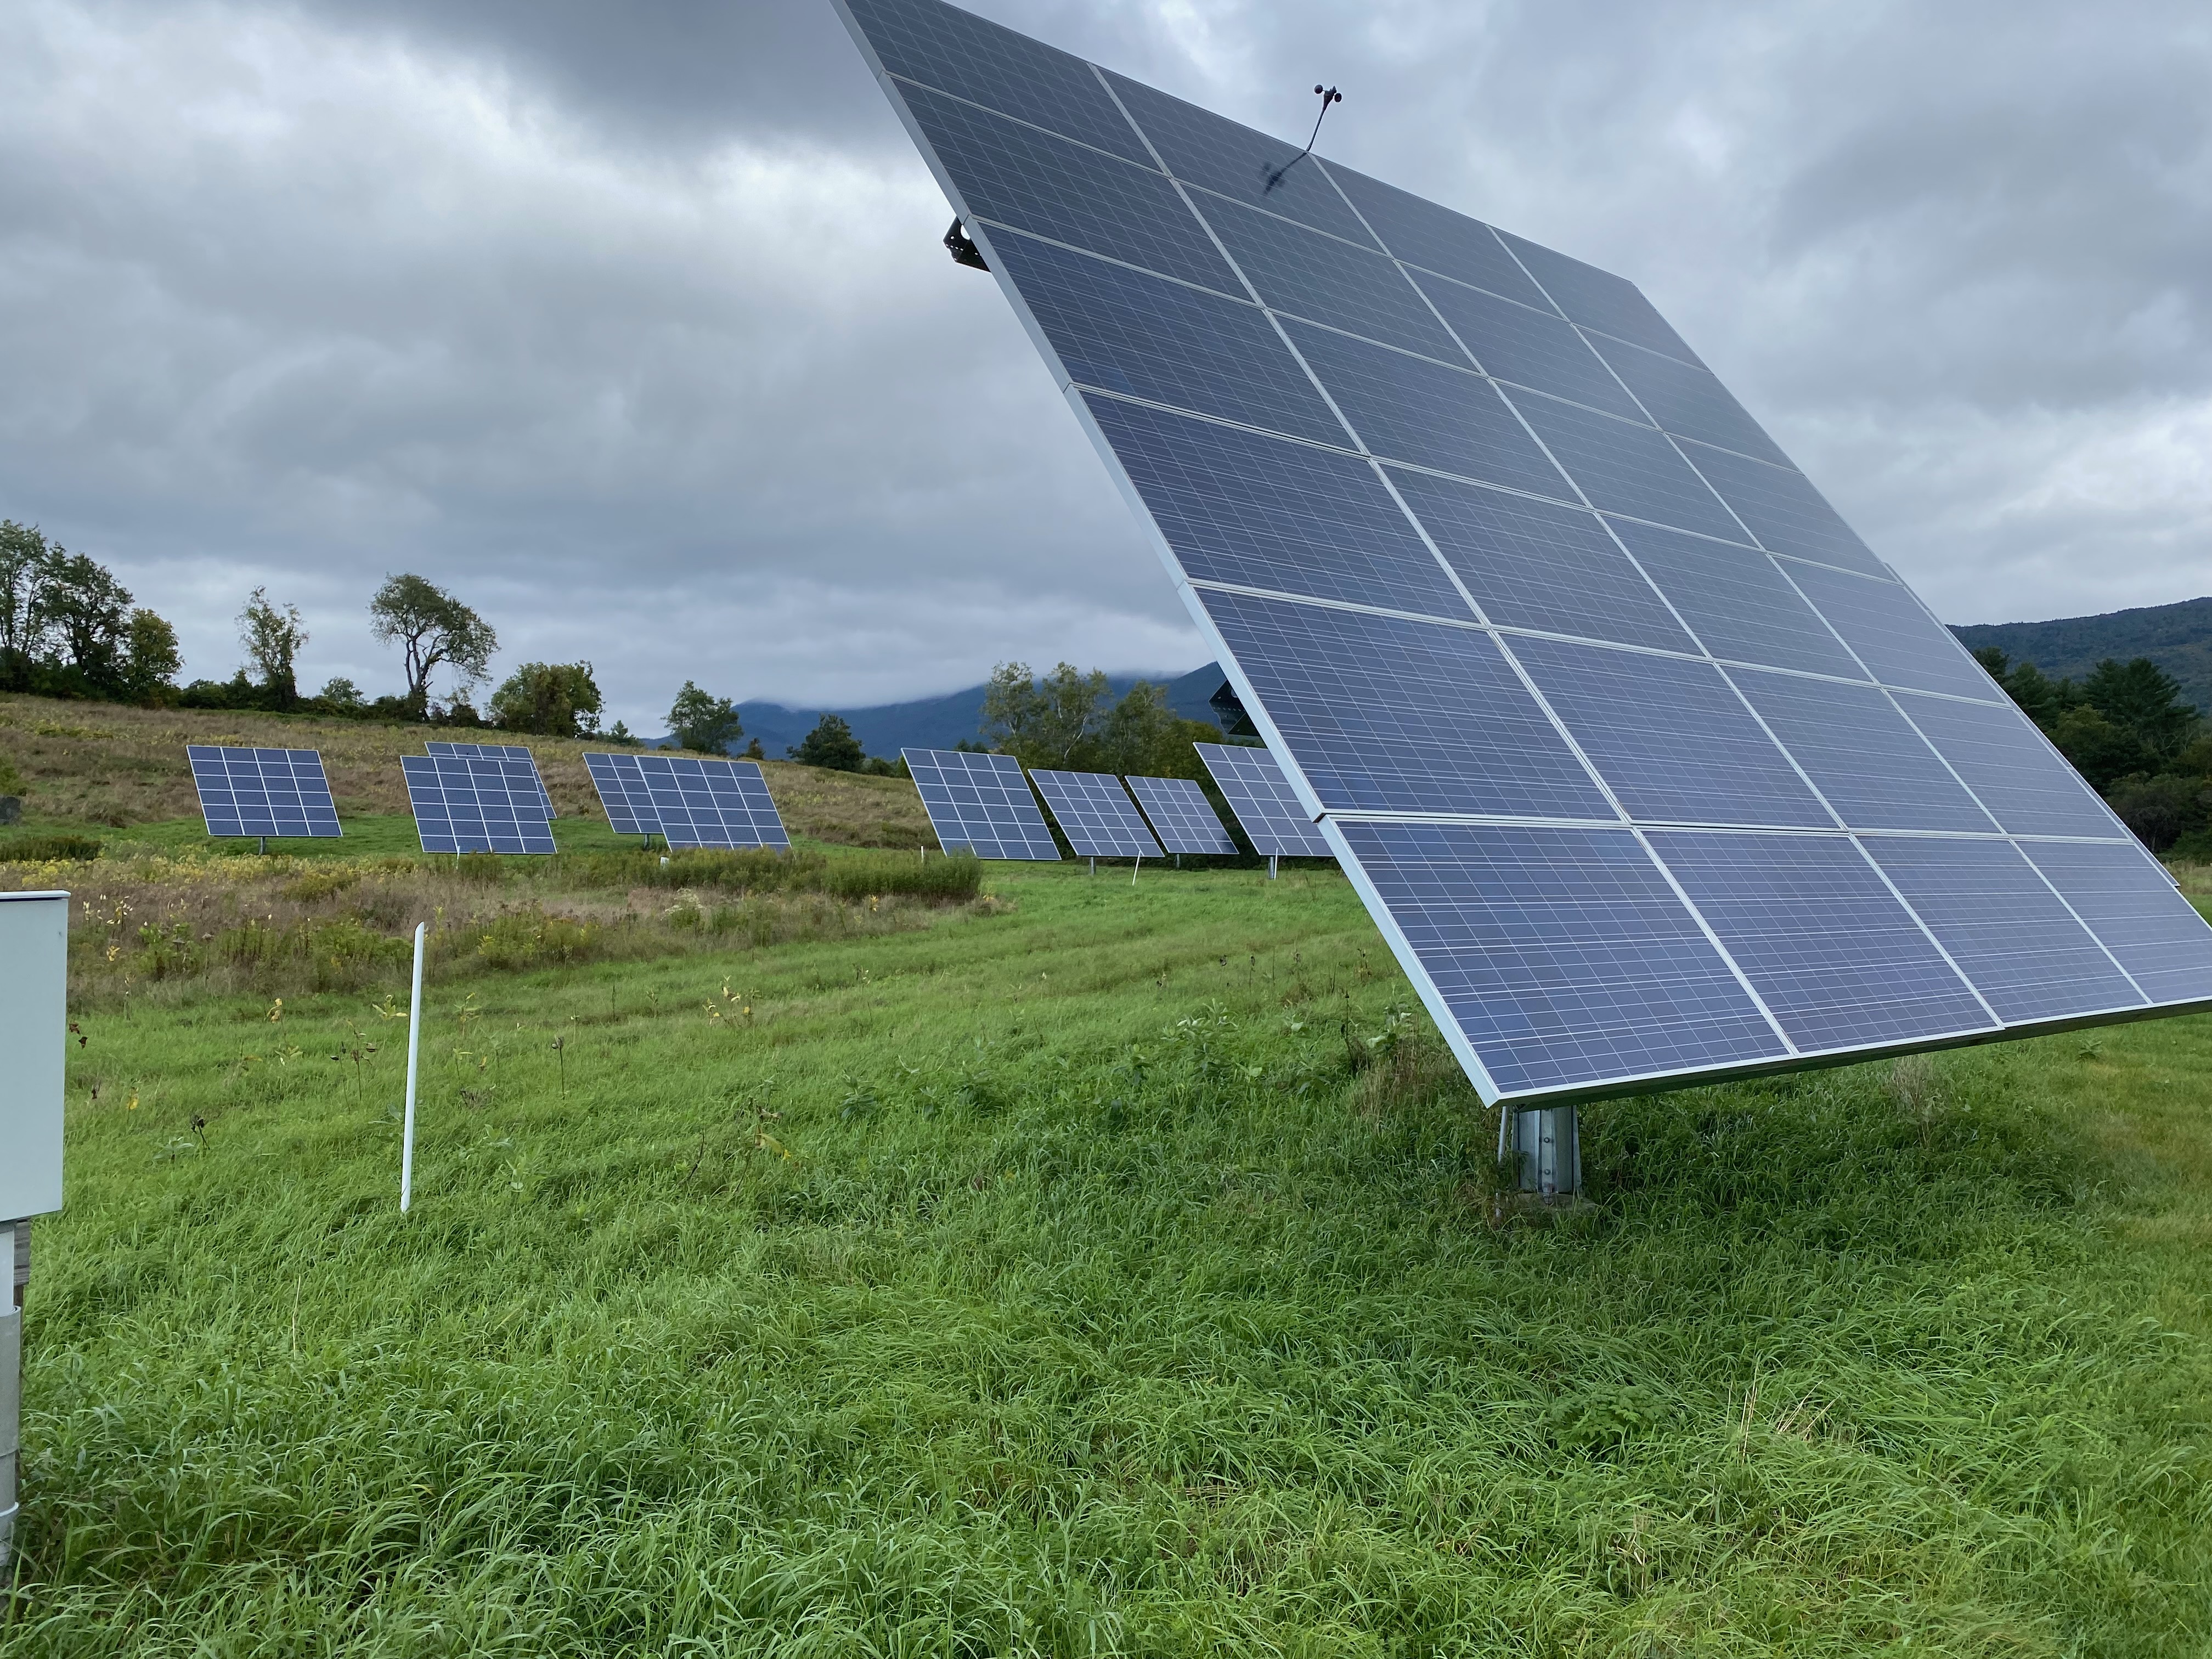
This unit is focused on renewable energy systems and sources. In contrast to fossil fuels, these sources are rapidly changing with respect to both technology and implementation. We will discuss the most common renewable sources (solar, wind, hydro, and geothermal) in more detail and briefly mention some, but not all, of the less common and emerging technologies. As we did with non-renewable energy in the previous unit, we will look at the primary energy sectors that use renewable energy and the fundamental calculations used to quantify energy generation, energy efficiencies, system capacity factors and Energy Return on Investment (EROI) for these renewable energy systems. We will close the chapter with energy storage, a critical component for renewable energy.
Learning Objectives
At the end of this unit, students should be able to:
-
Compare and contrast main renewable energy sources in the US and World
-
Define and use the Capacity Factor for renewable energy calculations
-
Give estimates of the Efficiency of different renewable energy systems
-
Estimate solar energy production from Solar PV Panel parameters?
-
Estimate wind energy production from Wind Turbine system parameters?
-
Explain typical efficiencies, capacity factors, and EROI for renewable energy systems
-
Explain the current major limitations for implementation of solar, wind, hydro, and geothermal energy
-
Define and explain Energy Return on Investment (EROI) for Renewable Energy Systems
-
Estimate renewable energy payback times with and without production credits and rebates
-
Define and explain Energy Return on Investment (EROI) for Renewable Energy Systems
-
Explain the main Triple Bottom Line Impacts (Emissions, Economics, Environmental Justice) For Renewable Energy sources across their life cycles
3.0.0.1 Additional Resources
University of Michigan Factsheets - an online source that’s updated yearly for sustainabilty referenced information. Within energy, there site contains information on Biofuels, Geothermal, Solar, Wind, General renewables, and Grid Energy storage. These factsheets are updated annually.
National Renewable Energy Laboratory - the US national laboratory site focused on renewable energy research and information
3.1 Renewable Energy
3.1.1 Introduction
Renewable energy is defined as energy generated from sources that are renewable, meaning there is no foreseeable limit to the amount of this energy source. This contrasts with fossil fuels which have finite amounts that can be extracted from the earth based both on supply, accessibility, and cost. The most commonly discussed renewable energy sources are solar, wind, hydropower, geothermal, and biomass.
While solar energy is generally considered as direct energy from the sun, it’s worth noting that most fossil and renewable energy sources are also based on indirect solar energy. Oil, natural gas, and coal are derived from biomass that was transformed under heat and pressure over hundreds of millions of years into chemicals which can be combusted to release energy. Wind energy is related to solar energy in the sense that the uneven heating of the planet by the sun leads to atmospheric pressure differences that drive wind currents. Solar energy also drives the water cycle and seasons which lead to rain and snow and water that either flows in rivers and streams or is collected in natural or man-made lakes. Biomass includes plants grown in the present with solar energy, and these can be harvested and converted to different types of energy sources as we will discuss in this unit.
Biomass, like fossil fuels, has chemical energy stored in the bonds of the carbon-based materials. Solar energy is electromagnetic energy while wind, hydropower and tidal energy are based on the kinetic energy within the moving molecules of air or water. Stored water in a reservoir has potential energy based on its height and is converted to kinetic energy when it flows.
Geothermal energy is due to heat in the earth and is not related to the sun, but is renewable on a human time scale. Tidal or wave energy is related to the moon’s gravitational pull rather than the sun, but is also considered renewable. Nuclear energy is due to energy within atoms and is not renewable nor related to the sun.
All of the basic units and energy concepts introduced in the previous chapter apply for renewable energy sources. There are important differences, however, in the efficiencies, capacity factors, and environmental impacts across the renewable energy system life cycles.
An important distinction to make from the start is that the “fuel” for renewable energy is provided for free as an ecosystem service. There are still limitations to the amount of sun, wind, and water available at a given time, but there are no fuel costs and much fewer life cycle inputs associated since these fuels are not extracted from the earth in a traditional sense. Deep geothermal energy is an exception to this as the hot steam from within the earth must be extracted by drilling and distributing this steam. All of these renewable technologies due have infrastructure associated with them, however, and solar photovoltaic panels, wind turbines, and hydropower dams have significant life cycle inputs and outputs associated with the equipment that transforms the energy from one form to another. This means that renewable energy sources also have tradeoffs, but they are different than those for fossil fuels.
3.1.1.1 Use Patterns of Renewable Energy
The consumption or use of energy generated from renewable source has been increasing rapidly in recent years relative to the fossil fuels as seen in many of the figures from the previous chapter.
For renewable energy sources, location is a key factor that determines the feasibility and amount of energy that can be obtained. This contrasts with fossil fuels which have the major advantage that they can be transported to and stored for future use in locations far from their extraction and refining origins. Trains, ships, trucks, and hundreds of thousands of pipeline miles efficiently move fossil fuels regionally, nationally, and globally. This transport of fuels has logistics, costs, and environmental impacts, but research and analysis shows that these impacts are relatively low compared to other phases of the fuel life cycle.
Renewable energy in the form of wood biomass was the primary source of heat energy (and building material) for centuries and drove the initial development in the US. Most forests in the US, especially on lands east of the Mississippi River, were cut down for fuel and building in the 18 and 19th century as the population expanded. Wood was replaced for fuel by coal and then oil in the latter half of the 1800s and then much more significantly in the 1900s.
Figure 3.1 shows these trends graphically as do several graphs in the previous chapter.
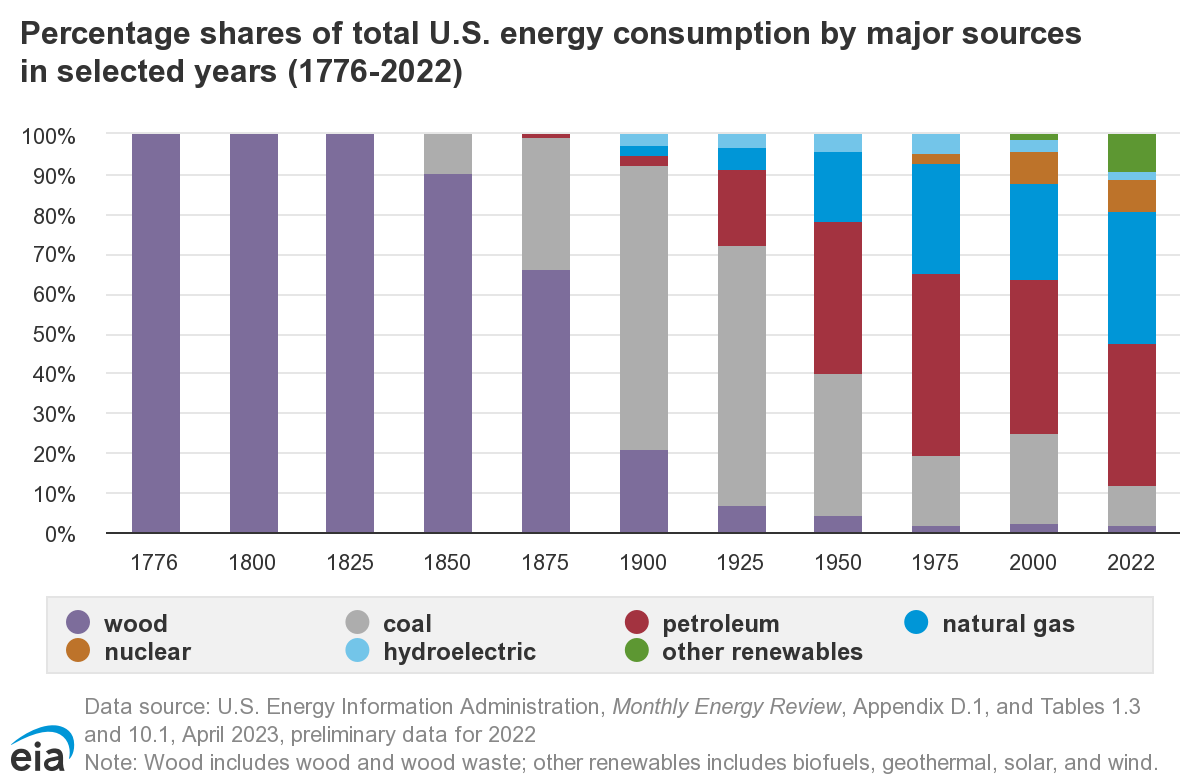
Figure 3.1: Distribution of energy consumption by source since 1776 in the US. Source: Energy Information Administration - https://www.eia.gov/energyexplained/renewable-sources/
The US energy consumption pie chart in Figure 3.2, shows that renewable energy made up approximately 13\(\%\) of the total energy consumption in the US in 2022. What may surprise most people is the fact that renewable energy is still dominated by biomass and only recently have wind and solar started to increase as technology improves and prices decrease. The renewable sources of wind, solar, hydro, biomass, and geothermal—surpassed coal-fired generation in the electricity generation sector for the first time in 2022 and are now second only to natural gas as shown in Figure @ref(fig:knitr-detailedrenewTrend. While biomass is a still the highest percentage of overall energy from renewables, this fuel is mostly combusted for heat or transportation fuel and only contributes a small percentage to electricity generation.
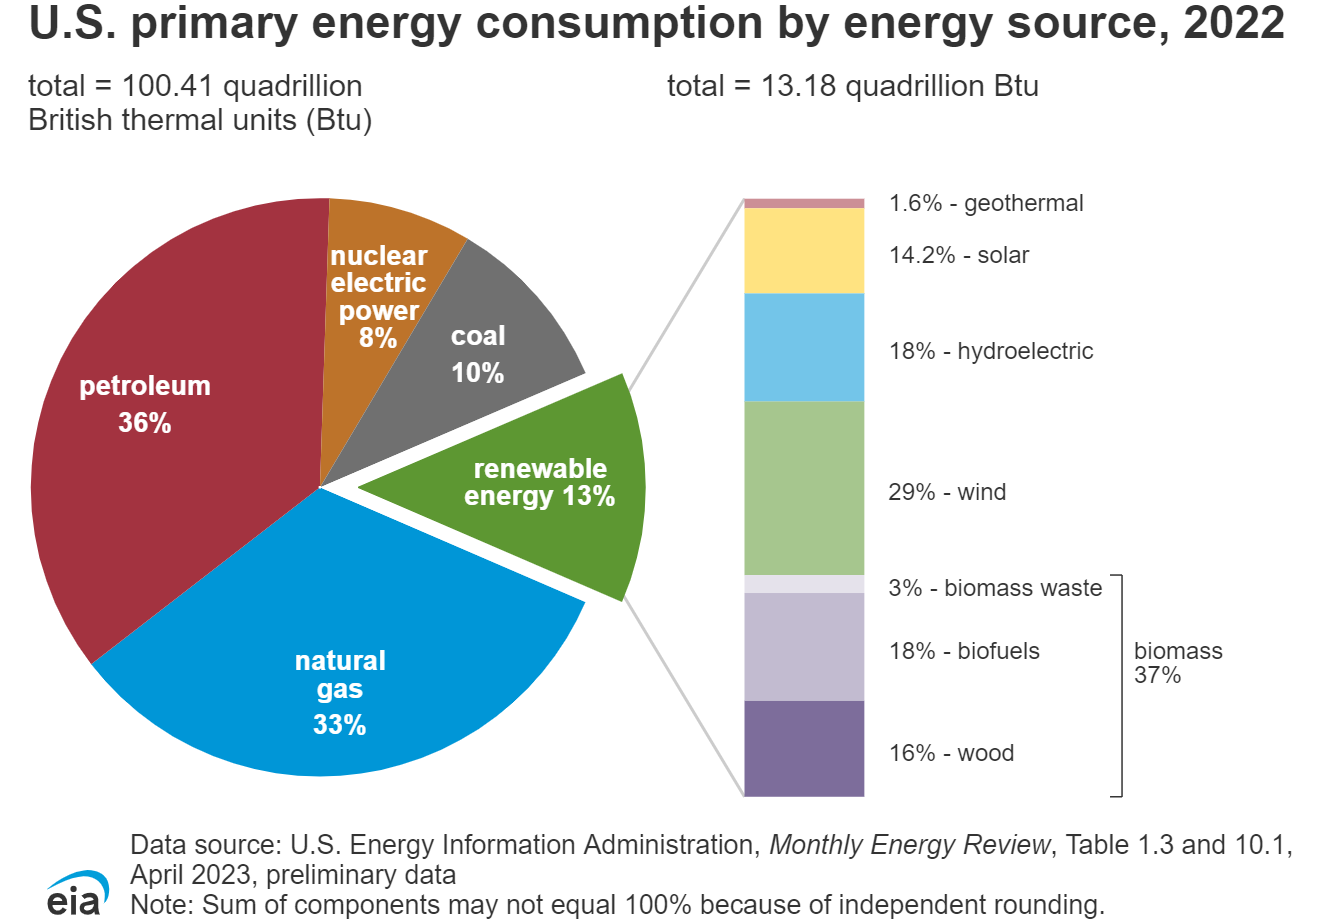
Figure 3.2: Detailed distribution of energy consumption by source in the US on 2021. Source: Energy Information Administration - https://www.eia.gov/energyexplained/renewable-sources/
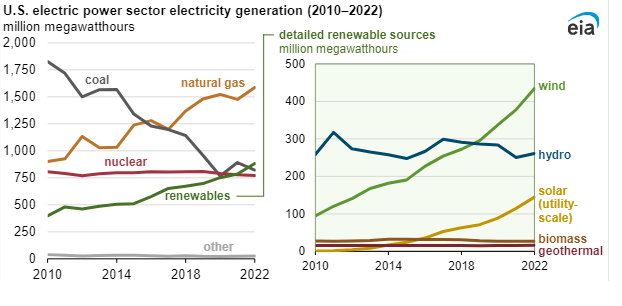
Figure 3.3: Detailed distribution of energy consumption by source in the US between 2010 and 2022. Source: Energy Information Administration - https://www.eia.gov/energyexplained/renewable-sources/
3.1.2 Solar Energy
3.1.2.1 Introduction
The distribution of solar energy incident across the globe is well measured which makes estimations of potential energy generation relatively easy. Insolation is the technical term for the amount of solar energy reaching the earth’s surface. While there are year-to-year small variations due to changes in the intensity of the sun, the earth’s orbit around the sun, and climate, solar data averages are reliable for forecasting solar insolation potential. Figure 3.4 and 3.5 show the solar radiation distribution around thw world and for the US. While there are other factors that will be discussed, these maps make it easy to see where solar potential is highest.
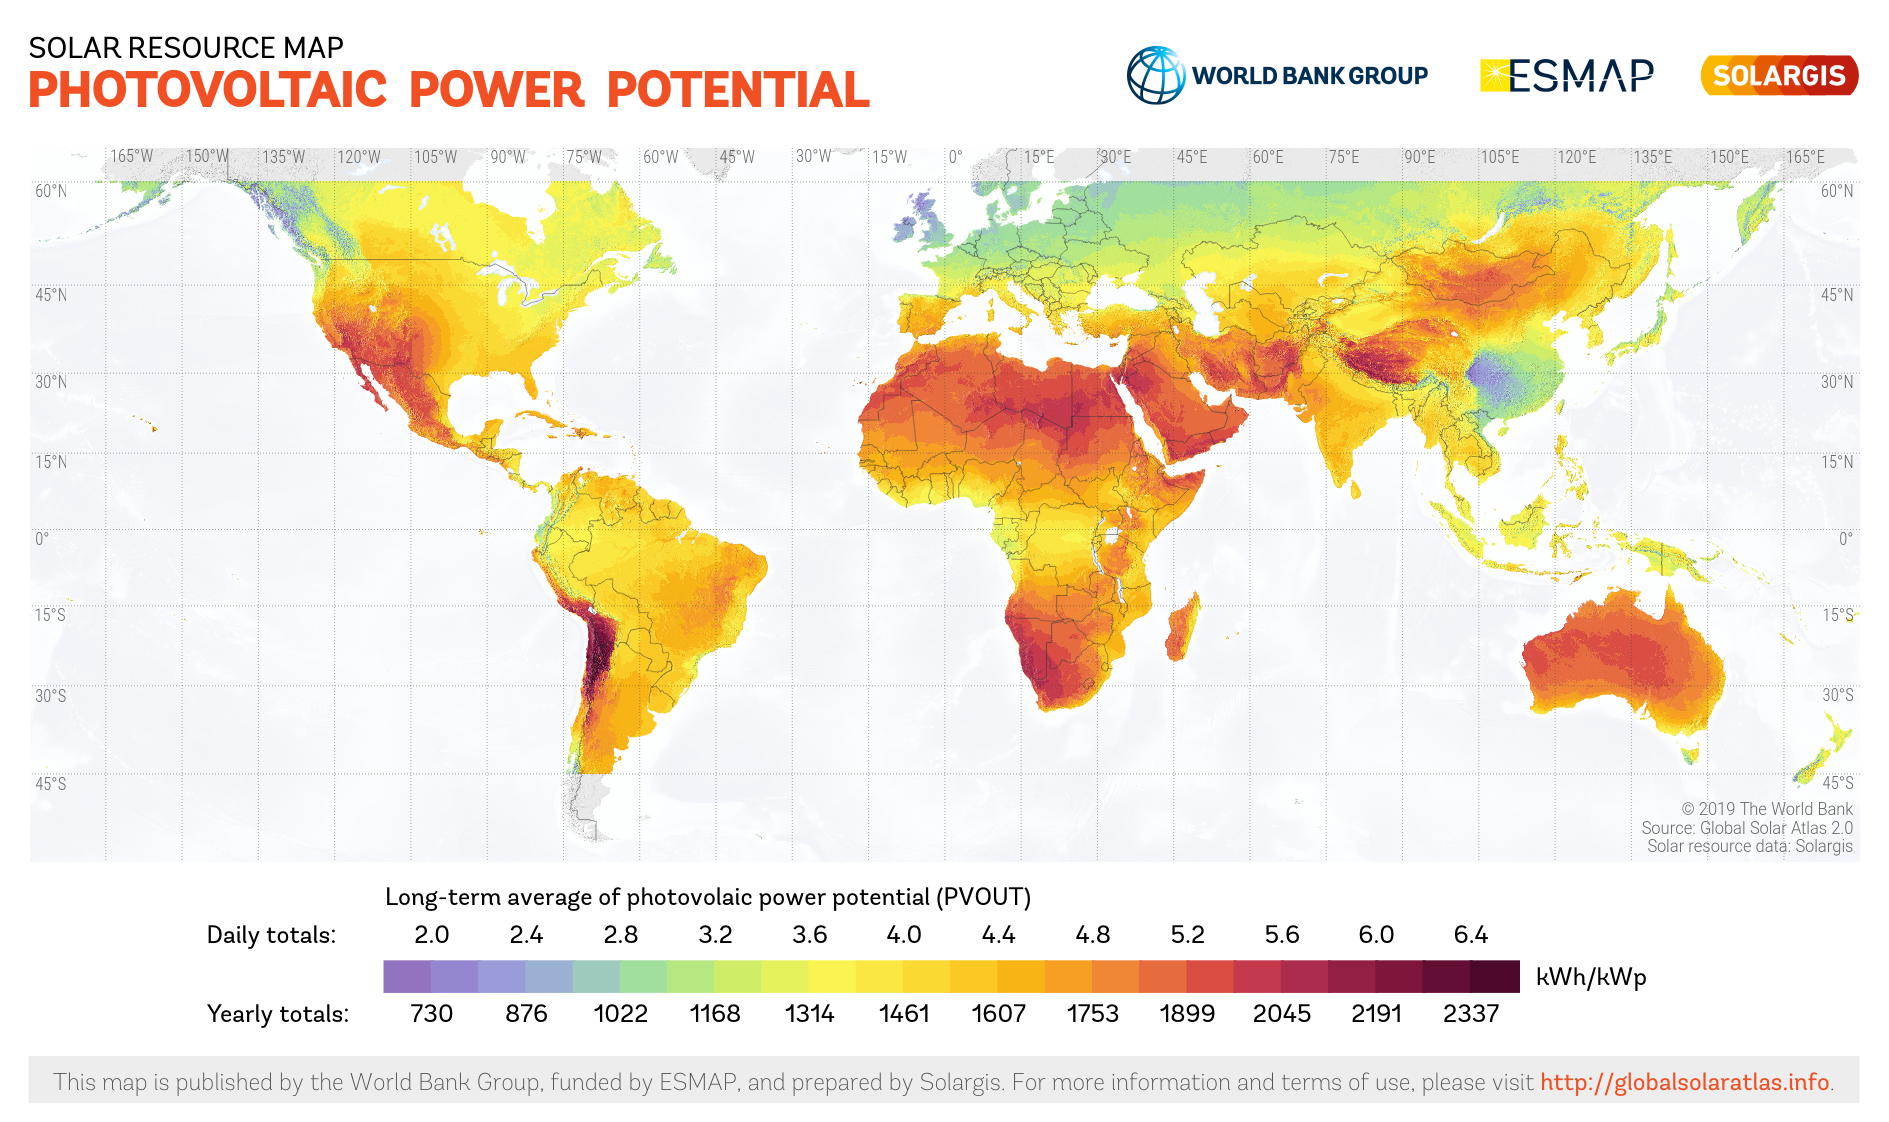
Figure 3.4: Detailed distribution of Solar Insolation across the world . Source: https://solargis.com/maps-and-gis-data/download/world
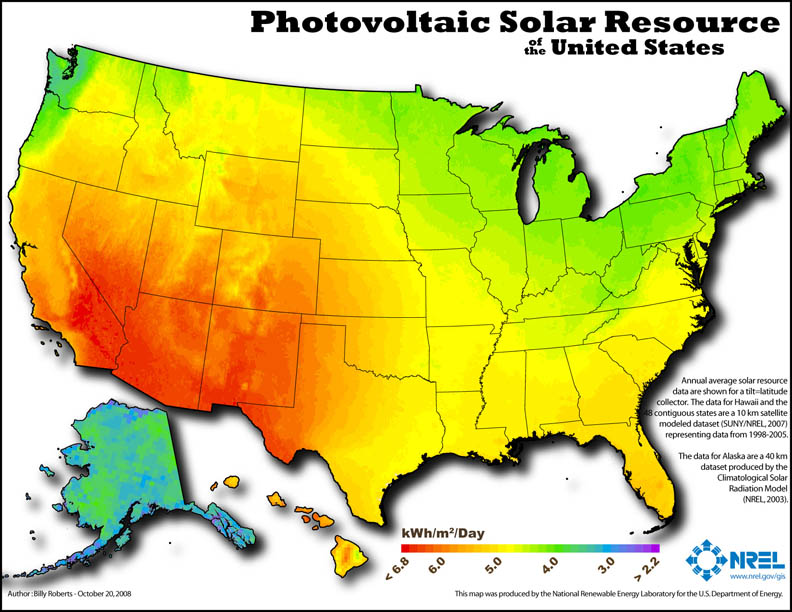
Figure 3.5: Detailed distribution of Average Daily Insolation in the US . Source: https://en.wikipedia.org/wiki/File:NREL_USA_PV_map_lo-res_2008.jpg
Interestingly, the places with the highest solar potential are not always the places where solar PV systems are installed. Figure 3.6 shows US solar power installations which are much more localized than one would expect from the solar potential maps. This is 2017 data, so there are some changes, but still there is something unexpected about this map. Can you think of factors that influence the location of solar systems in this figure?
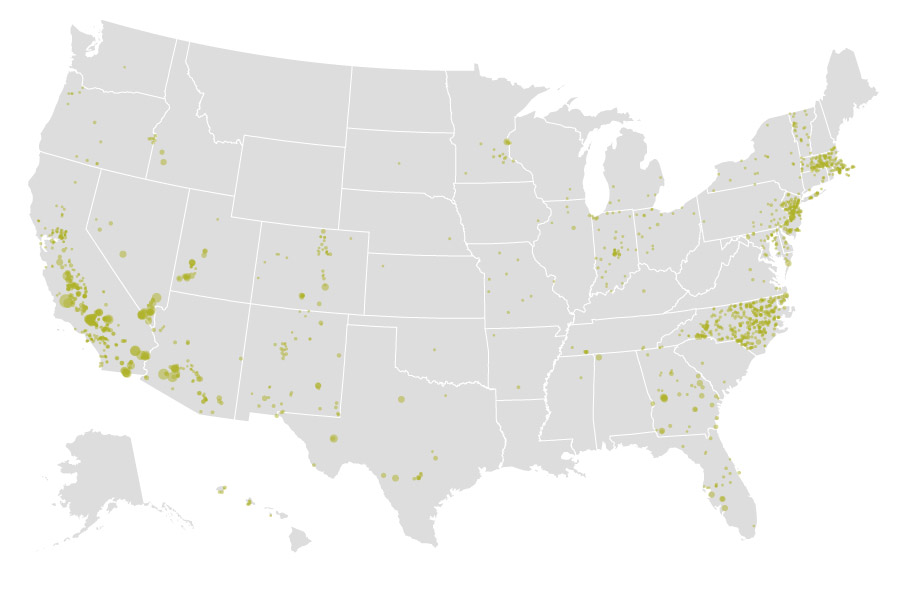
Figure 3.6: Detailed distribution Solar PV Power Plants in the US in 2017. Source: Washington Post, Mapping how the United States generates its electricity, March 2017, https://www.washingtonpost.com/graphics/national/power-plants/
Worldwide, solar energy is increasing across the globe with China leading the way as shown in Figure 3.7. Note that this figure, from Our World in Data website, is plotted on a log scale so China has more installed solar than all of the rest of the countries on this chart combined. This website has a powerful database and interface that allows one to analyze data and add any countries of interest.
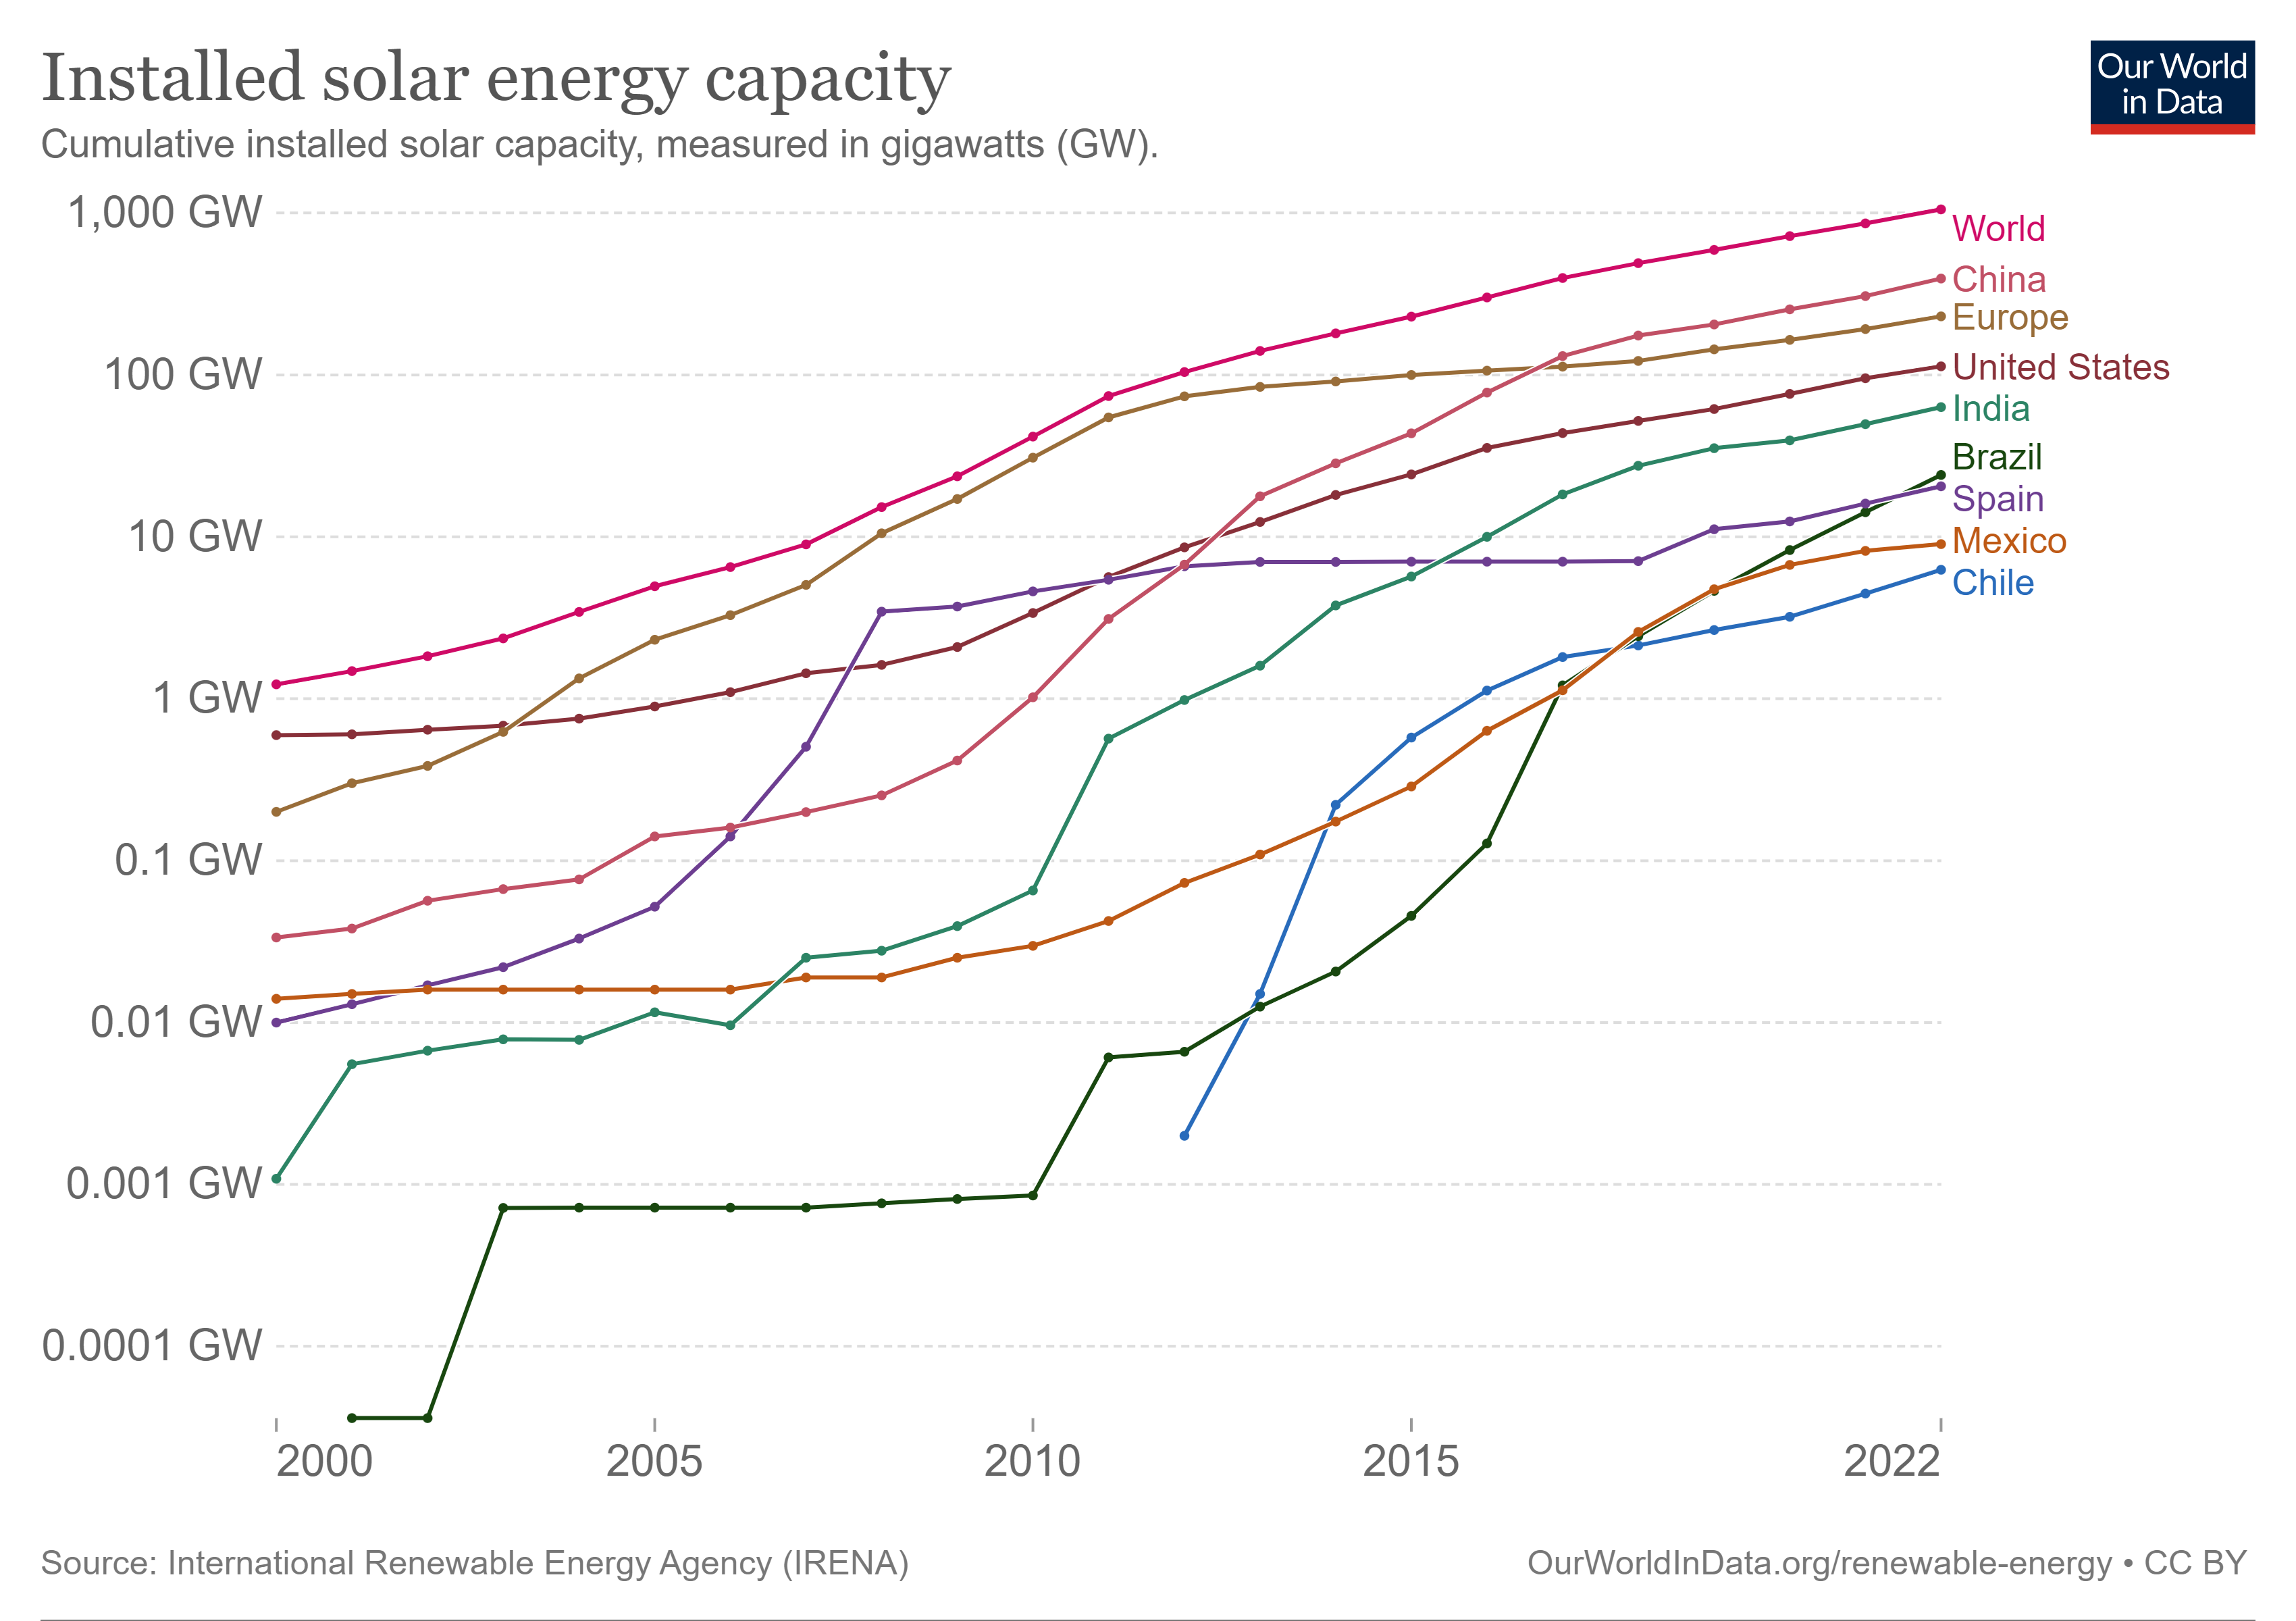
Figure 3.7: Worldwide Installed Solar Capacity. Source: https://ourworldindata.org/grapher/installed-solar-PV-capacity
Unlike fossil fuel power plants in which the fuel is extracted, stored, and transported to the plant where we control its use to generate energy, solar energy availability varies by location, date, and time. As you know from life experience, the sun rises in the east, moves from the horizon to a position high in the sky depending on the seasons, and then sets in the west. Because we understand planetary motion very well, we can predict the sun’s location at any time. This solar motion is shown schematically in Figure 5. Both the altitude and azimuth angles in this figure can be calculated from relatively simple equations found easily (see here for example). From this movement of the sun, south-facing panels (= 0) will produce the most energy on average in most locations. As the orientation of solar panels moves from facing south, the energy is reduced. This reduction is easily quantified so a solar designer can predict energy production for house roofs and other locations which are limited by geometric constraints. The angle of the panels with respect to the ground (= 0) also affects the amount of solar radiation that is incident on a panel.
Many solar panels are installed in a fixed position, for example on a residential house roof with a given pitch, but you can see from Figure 3.8 that more energy could be produced if the panel were moved throughout the day along the \(\phi\) axis, with the panel moving from east-facing in the morning through south at midday and to the west in the evening. Similarly, panels could be moved along the \(\beta\) axis seasonally with higher angles in the winter when the sun is relatively low above the horizon and lower angles in the summer when the sun is high overhead. For a fixed position, setting \(\beta\) equal to the latitude of the location on the globe will generally produce the highest average energy production annually.
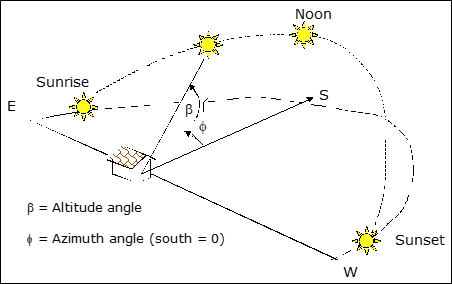
Figure 3.8: Incomings solar energy geometry over the course of a day. Source: J. Randolph and G. Masters, Energy for Sustainability, Island Press, Fig. 7.1, pp. 264, 2008.
While following the sun along 1-axis or 2-axes generates more energy, this comes with the tradeoffs of higher complexity and cost. Tracking systems require energy, motors, gears, and a control system that need maintenance. Generally, tracking systems can payback their extra costs and complexity for large commercial or utility scale projects but not for small residential projects. Solar project developers use solar tracking software to make energy calculations and compare the extra energy generated by tracking along one or two axes compared to the additional costs.
3.1.2.2 Basics and Calculations
Solar radiation units are not as straightforward as the energy units for fossil fuels as they are based on the area and angle of the sun’s incidence rather than the mass or volume of solid, liquid, or gas fuels. It is critical for solar calculations to use the proper units.
Irradiance, (wequation (3.1)) also called radiative flux or radiative flux density, is the amount of power radiated through a given area at any instant. The units for irradiance are power per unit area, for example kW m-2. This power is instantaneous and generates energy over time. (E = P x t).
\[\begin{equation} Irradiance = \frac{Power}{Area} \tag{3.1} \end{equation}\]
where power is given in the metric units of W, and area is in m2.
A standard irradiance value is useful for industry to standardize testing conditions since the sun intensity values in different locations. Without such a standard, solar project developers would need to convert panel power ratings based on location. Fortunately, the average irradiance around the world is approximately 1 kW m-2 so this easy to remember benchmark is used as the standard irradiance (Istc) for testing and rating solar panels. Solar panels are exposed to a standard irradiance of 1 kW m-2 of simulated sunlight wavelengths under laboratory conditions to measure the power generated by panels. This leads to a power rating, Prated, for solar panels which is proportional to their surface area. This rated power allows designers and users to make solar energy generation models based on adjustments for their local radiance and conditions compared to the standard irradiance values.
Insolation (short for incident or incoming solar radiation that reaches the earth’s surface) (equation (3.2)) is a related measure of solar radiation energy received on a given surface area over a given time. It is sometimes called solar irradiation or solar irradiation and the units are kWh m-2 as shown in Figure @ref(fig:knitr-InsolationWorld. This value is the solar input, so the output for a solar photovoltaic panel which converts solar radiation into electrical current is given by the insolation multiplied by the area of the panel and its efficiency.
\[\begin{equation} Insolation = \frac{Power \times time}{Area} \tag{3.2} \end{equation}\]
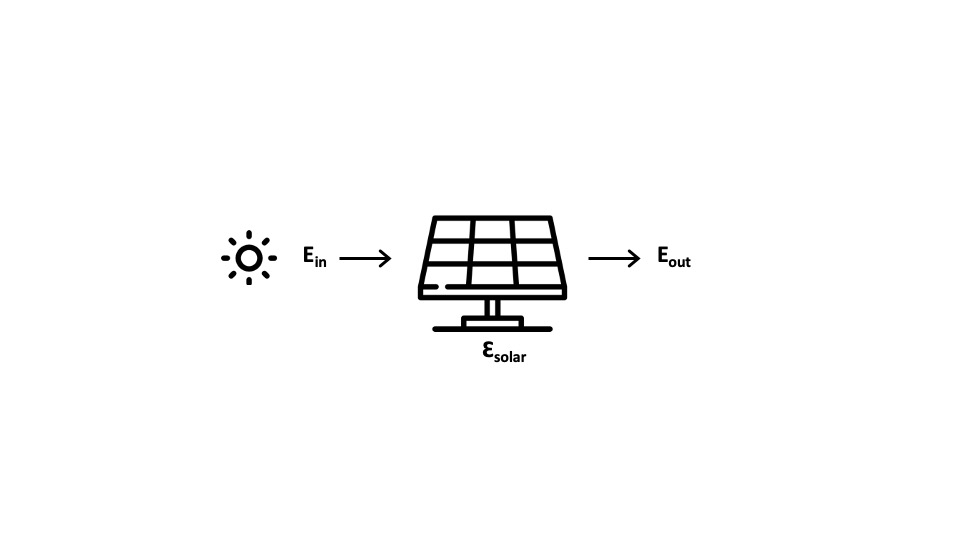
Figure 3.9: Solar diagram representing incoming primary energy from the sun and secondary energy converted to electricity.
Average Daily Insolation (Is) is the insolation averaged over a time period – typically a day (equation (3.3)). Units in this case are kWh m-2 day-1 which can simplify energy calculations further. Figure 3.5uses the metric for the solar color-coding on the US map and these values are easily found for any location in the world. The table below includes the average daily insolation values for south-facing panels in a few US Cities for different tilt angles () and tracking for 1 and 2 axes. Note the variation in the table values for location and tilt angle. Can you explain these variations based on what you have just read?
\[\begin{equation} I_{s}=\frac{Insolation}{RecordingTime} = \frac{Power \times time}{Area \times RecordingTime}=\frac{W \times h}{m^{2} \times day} \tag{3.3} \end{equation}\]
Solar annual average insolation in kWh m-2 day-1 for south-facing surfaces. Adapted from J. Randolph and G. Masters, Energy for Sustainability, Island Press, 2008.
Solar annual average insolation kWh m-2 day-1
| Tilt Angle | Tuscon, AZ | Boulder, CO | Atlanta, GA | Roanoke, VA |
|---|---|---|---|---|
| Horizontal | 5.7 | 4.6 | 4.6 | 4.2 |
| L - 15 | 6.3 | 5.4 | 5.0 | 4.8 |
| Lat | 6.5 | 5.5 | 5.1 | 4.8 |
| 1-Axis (Latitude) | 6.4 | 7.2 | 6.6 | 6.1 |
| 2 - Axis | 9.0 | 7.4 | 6.6 | 6.3 |
Solar photovoltaic panels convert electromagnetic solar energy (photo-) into direct electrical current (-voltaic). It is beyond the scope of this text to explain the physics of solar photovoltaics in detail, but briefly this depends on the electrical properties of materials like silicon (Si), gallium arsenide (GaAs), or cadmium telluride (CdTe). These semiconductors have atomic electron energy levels which do not conduct electricity easily like metals which are conductors. As shown in the simple solar panel schematic of Figure 3.10, current solar photovoltaic (PV) panels depend on multi-layer semiconductors in which an n-type material which has additional electrons is paired with p-type material with missing electrons. Solar PV panels also have metallic conductors on the front surface and an anti-reflective glass protective plate to maximize the sunlight that reaches the semiconductors while being transparent, strong and durable over their 20+ year lifetime.
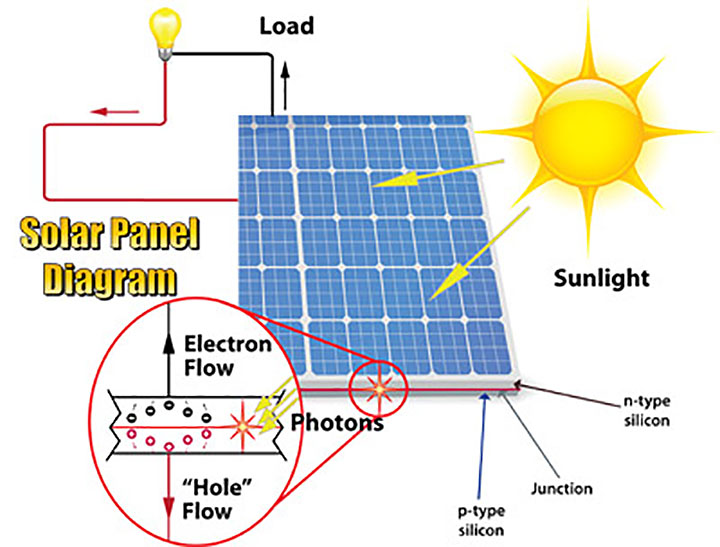
Figure 3.10: Solar Photovoltaic Schematic . Source: https://etap.com/renewable-energy/photovoltaic-array-fundamentals
The efficiency of semiconductors to convert solar radiation (photons) to electrical current depends on the detailed composition, electronic structure, and physics of the materials in the panels. This efficiency is still defined as the output energy (electricity) divided by input energy (incident sunlight). Material scientists, chemists, physicists, and electrical engineers are continually developing new materials for photovoltaic systems. In the research lab, these efficiencies are approaching 50% while in current practice solar photovoltaics that are commercialized have efficiencies around 20%. As efficiencies increase, more electricity is generated from less area given the same incident sunlight. Figure 3.11 from the National Renewable Energy Research Lab (NREL) shows the historical trend for different solar photovoltaic materials over the past few decades.
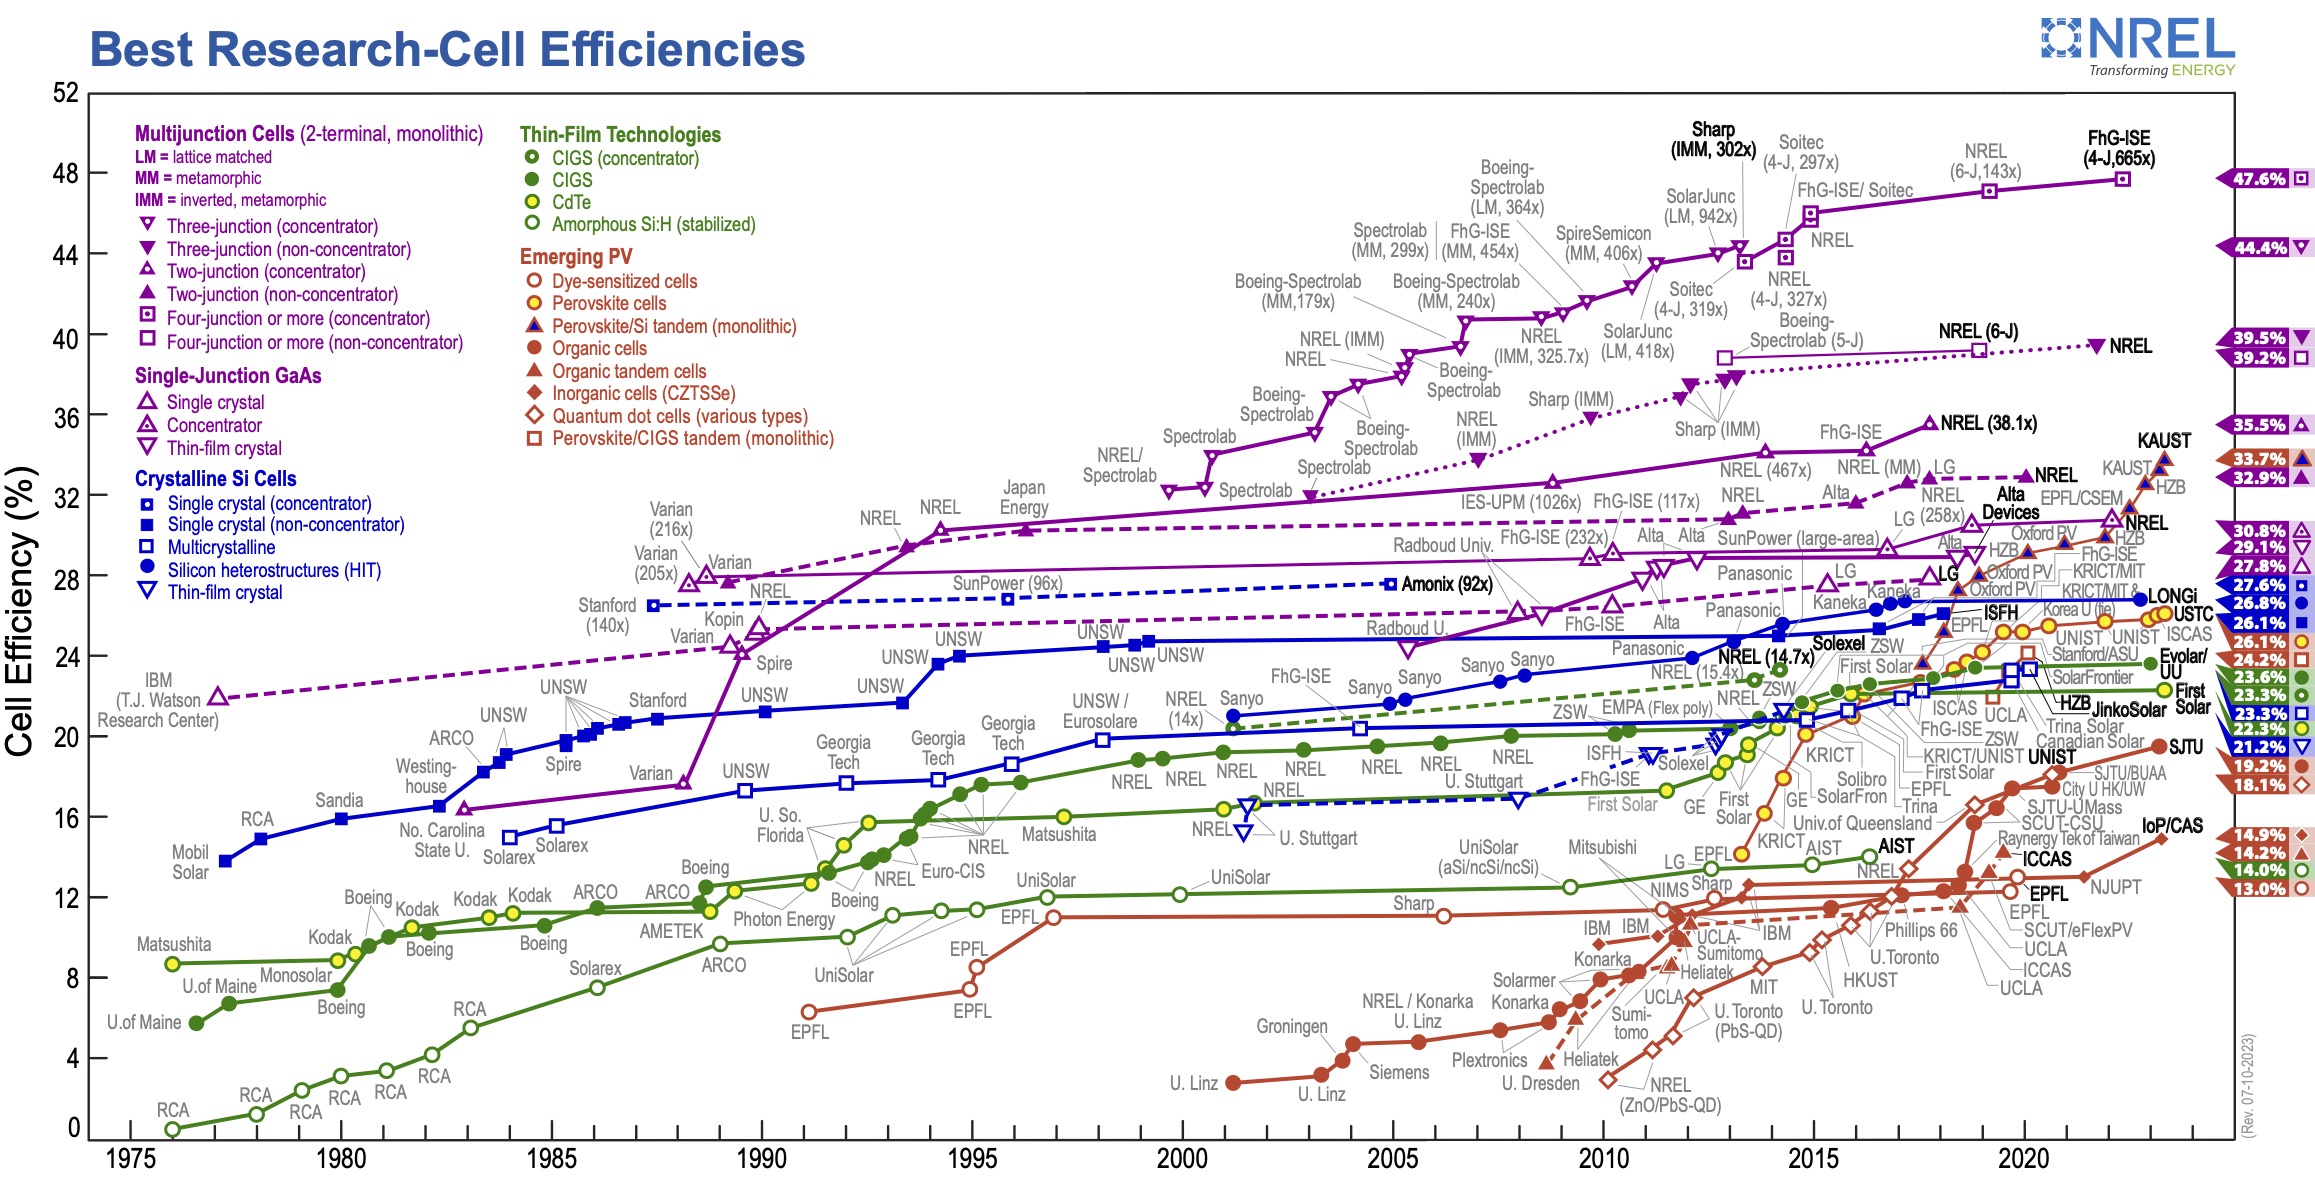
Figure 3.11: Solar Photovoltaic Research Efficiencies from 1975 through th 2023. Source: https://www.nrel.gov/pv/cell-efficiency.html
Solar PV panels generate direct current from the electrons flowing in the circuit due to the photoelectric effect explained above. This direct (DC) current is converted to alternating (AC) current by an inverter to match the electric grid. Off-grid solar installations can use DC current without conversion, for example for a boat or cabin in the woods, but then all the appliances and equipment must also be designed for DC current. Inverter efficiencies have increased in recent years and are now 95% or higher. Additional efficiency losses in solar PV systems includes the wiring, connections, panel degradation, and more factors wwhich can be bundled together for simple energy estimates into a single __ derating factor (DF)__ which is typically on the order of 75 – 85%. A more accurate DF is given by the multiplication of all efficiency losses together. In full solar PV design, more sophisticated software models allow for the modeling of the individual efficiency losses for dozens of factors. An example of a more sophisticated software which is available online is PVWatts from NREL if you are interested in playing around with the parameters to see their effects on solar energy generation.
The simple equation that we will use in this class to quickly estimate solar PV energy generation is shown in Figure 3.12 and equation (3.4). Translated to words, the energy generated in a year is estimated by the number of Panels multiplied by the Rated DC Power per Panel multiplied by the Derating Factor multiplied by the Average Solar insolation divided by the Standard Irradiance and then multiplied by Time. Energy generation for a different time unit is easily calculated simply by changing the time variable. Unit analysis is helpful in this case: kWh yr-1 = Panels x (kW/panel) x (%) x (kWh m-2 day-1) / (1 kW m-2) x (days/yr). Note that to make these units cancel out properly, tannual must be in units of days/year. This equation provides a quick and good estimate of energy production for solar panels without the need for a solar PV modeling program.
\[\begin{equation} E_{annual}= n \times W_{p} \times DF \times \frac{I_{s}}{I_{STC}} \times t_{annual} \tag{3.4} \end{equation}\]
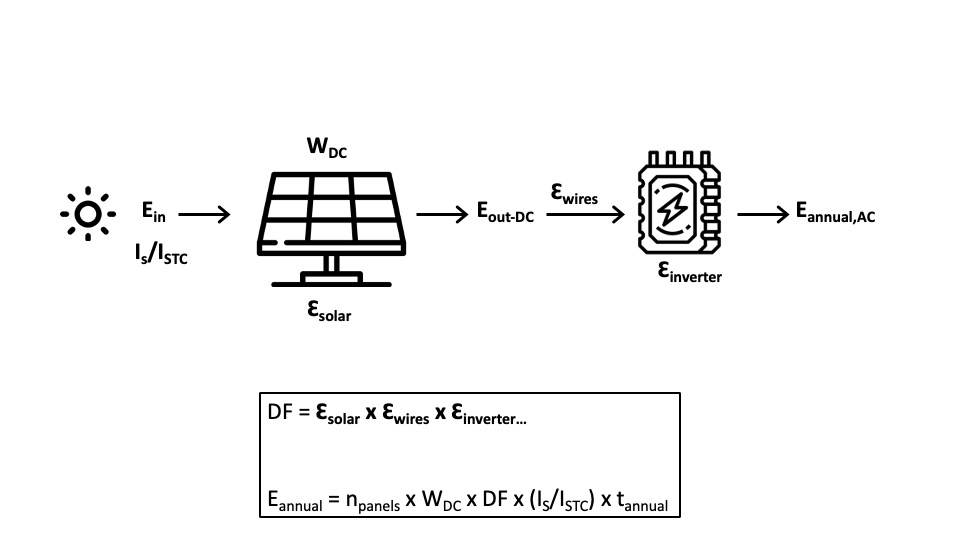
Figure 3.12: Solar diagram and equation representing the conversion of incoming energy (insolation) to usable energy.
As mentioned earlier, the DC panel power is measured by the panel manufacturer and this power rating is published in units of Watts (Wdc). This is the power generated at the standard solar irradiance (ISTC) defined as 1 kW m-2. In the equation above, it is easy to forget about including (ISTC) since the factor of 1 might not seem to make a difference. However, this is problematic as the units will be wrong, which in turn may make you think that you need to include another factor. One way to think about the solar radiation ratio in the equation is that it represents the average number of sun hours at standard conditions. A value of 4.8 hours for this ratio in SW Virginia means that, on average over a year, the total intensity of the sun averaged over a day is equivalent to 4.8 hours at the standard irradiance value of 1 kW m-2. This ratio of actual daily insolation to average global sun insolation in the calculations is much simpler than integrating the sun over the course of a day.
Exercise: Dr. McGinnis’s household solar PV array.
As an example of a recent solar PV project, Dr. McGinnis installed solar panels on his roof in 2022-23. Twenty-seven (27) LG Neon2 Solar Panels with a rating of 360 Wdc were installed on 3 roof sections with different orientations. The total project cost was $2.52/Wdc, not including the available 30% IRA federal tax credit.
To answer the questions below, use an overall derating factor (DF) of 75% due to alignment of 2/3 of the panels away from south, a Roanoke Insolation value of Is = 4.8 kWh/(m2 x day), and a local utility (Appalachian Power Company) electricity cost of $0.16/kWh.
Part 1. How much electricity can this array generate in an average year (kWh/yr)?
Eannual = n x Wp x DF x (IS/ISTC) x tannual
E = (27 x 360 W x (1 kW/1000 W) x 0.75 x (4.8 kWh m-2 day-1 / 1 kW m-2) x 365 days yr-1)
E = 12,772 kWh/yr
Part 2. What is the simple payback time (years)? Recall that payback time was introduced in the previous chapter.
PayBackTime = Ccapitalcost / Sannual
PayBackTime = ($2.52/Wdc x n x Ppanel rating x (1 - credit)) / (Eannual x $0.16/kWh)
PayBackTime = ($2.52/Wdc x 27 x 360 W~ x (1 - 0.3)) / (12,772 kWh x $0.16/kWh)
PayBackTime = 8.4 years
Part 3. How much will the household GHG emissions be reduced per year (tons CO2/yr) if the utility electricity carbon emissions are 1.50 lb CO2/kWh (ignore solar array lifecycle emissions for extraction, manufacturing, transportation and installation)?
CO2 grid = ECgrid x Eproduced
CO2 grid = 1.50 lb CO2/kWh x 12,772 kWh yr-1 x (1 ton / 2000 lbs)
CO2 grid = 9.6 ton CO2 yr-1
The solar PV energy equation above is generally used for solar energy generation estimates instead of capacity factor equation that was used for fossil fuel power plants. The concept of capacity factor – actual energy produced divided by the PV panel rated energy - still applies for solar PV systems, but is more complicated than for traditional steam power plants. While power plants generally run near their rated power during operation, the power for a solar PV panel depends directly on the amount of light available and varies throughout the day. The capacity factor for solar PV is simply the solar insolation value for a location in kWh/(m2 x day) divided by 24 kWh/(m2 x day), the insolation if the sun were shining 24 hours a day. You can see in Figure 3.13 that capacity factors for solar power plants in the US average 25%, and remember this is based only on availability of sunlight and any maintenance, not the efficiency of the system.
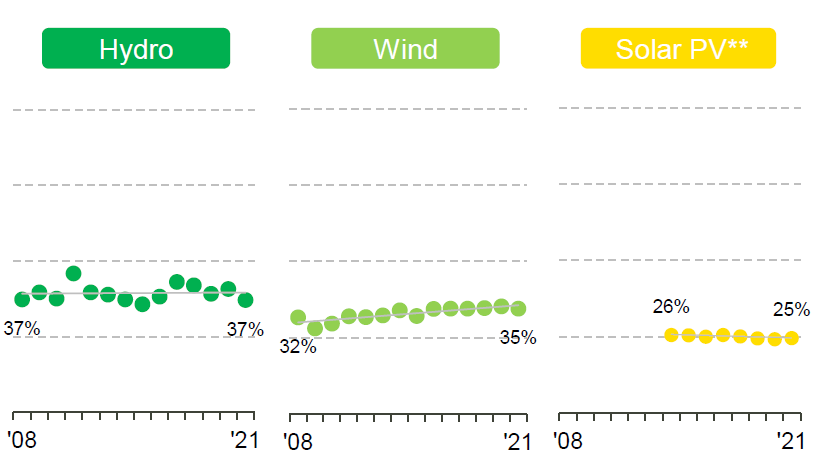
Figure 3.13: Capacity factors for renewable energy facilties. Source: Benchmarking Air Emissions of the 100 Largest Electric Power Producers in the United States Data tables and maps at: www.sustainability.com, September 2022.
Residential houses and commercial buildings can have solar PV that is either off-grid or grid-connected. These options are shown om Figure 3.14 and 3.15. Off-grid systems are not connected to the electrical grid so electricity is only available at the level produced by the available sunlight at any point in time. Batteries are added to store excess electricity not used immediately for later use. Battery systems will be discussed in more detail later, but given battery prices and the reliability of most utility grides, this technology is not yet common for residential housing.
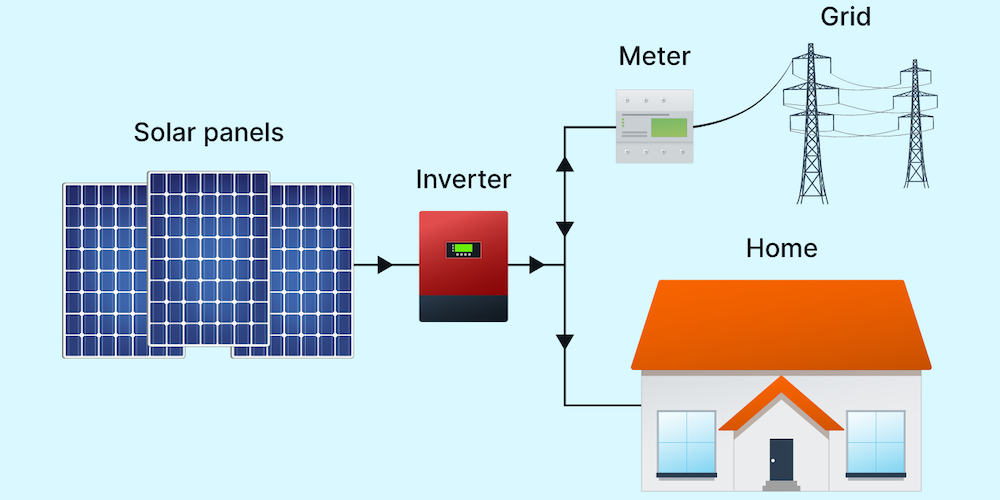
Figure 3.14: Solar Panel Connection Options (top: grid -connected, bottom: off-grid). Source: https://www.solarreviews.com/blog/grid-tied-off-grid-and-hybrid-solar-systems.
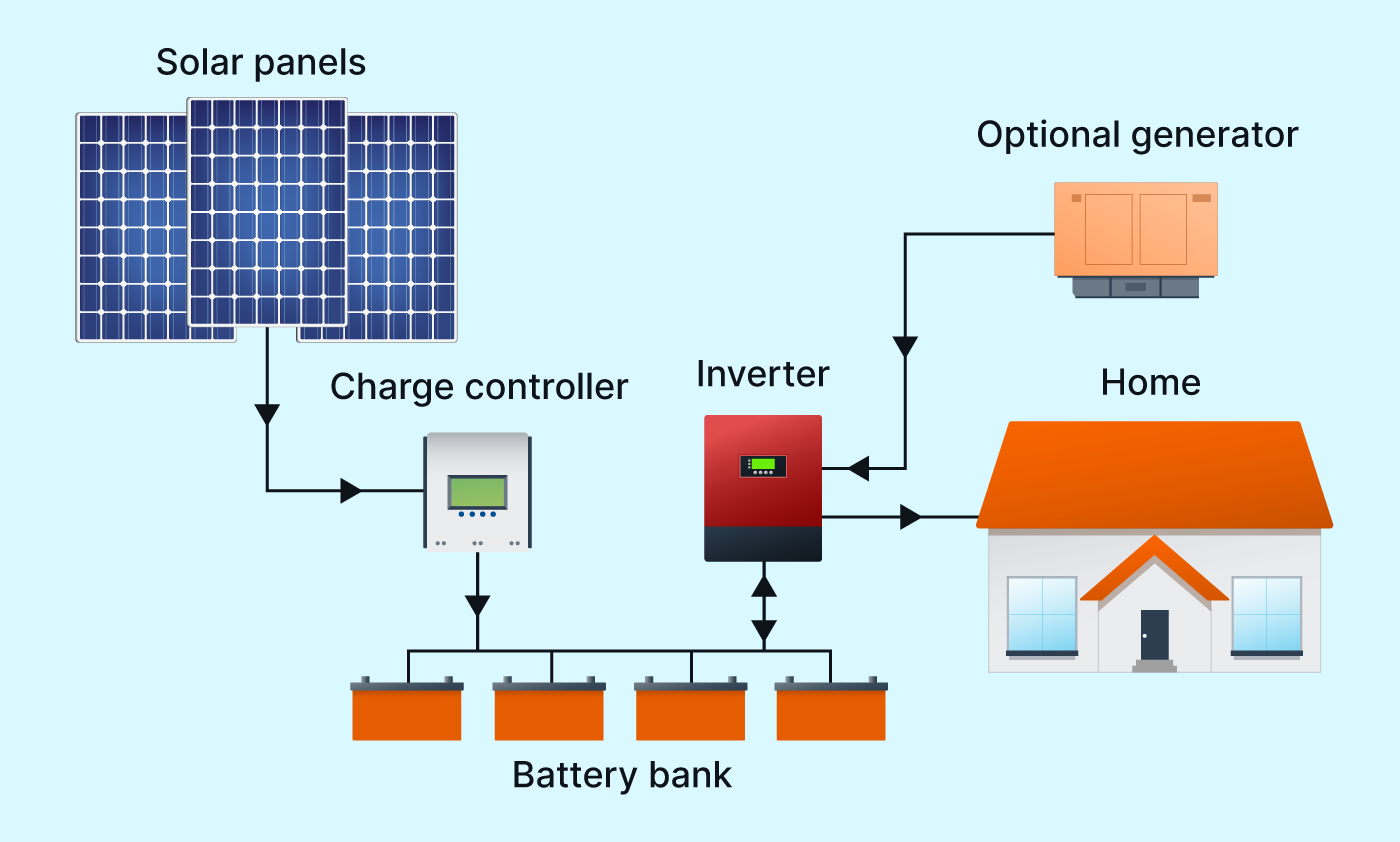
Figure 3.15: Solar Panel Connection Options (top: grid -connected, bottom: off-grid). Source: https://www.solarreviews.com/blog/grid-tied-off-grid-and-hybrid-solar-systems.
Grid-connected system are electrically connected to the existing local utility grid and the building which allows electricity to flow in both directions, to the house when the solar PV is not generating enough electricity to meet current demand or back to the grid when the solar PV system is generating more electricity than is needed. When excess electricity is sent back to the grid, the electric meter runs in reverse, in essence subtracting electricity that you have used from your bill total. Depending on where you live and the utility, electricity sent back to the grid is handled differently. In Virginia, electricity in excess of consumption is considered a credit that can be saved and used later in the year. However, utilities in Virginia also limit the size of residential systems to the approximate annual demand of the house to limit these credits. Some utilities and states offer direct electricity payments instead of credits or electricity payments that vary on the grid demand when the excess electricity is generated.
Batteries can also be added grid-connected systems for a hybrid system which allows more flexibility in controlling electricity flows. In a later chapter, we will discuss these more complex systems in which solar PV panels, batteries, buildings, and electric vehicles are all connected. In such a system, the amount of electricity flowing between these different parts of the system can be controlled at any time using a consumer app.
3.1.2.3 Utility Solar
Solar PV flat-panels can be scaled up into much larger arrays for commercial or industrial energy generation. This has the advantage of economies of scale but often requires much more space and infrastructure than for rooftops. Solar PV panels designed over the land, roads, or parking lots have higher costs due to the structures required to support them. There is also often some controversy among different stakeholders when land for solar energy is cleared of forests or replaces agriculture. Nonetheless, these larger arrays are becoming more common as solar panels prices drop with higher production, improved manufacturing and more implementation. Figure 3.16 shows solar panels over a parking area at the Cincinnati Zoo. This type of design also reduces the temperature in the parked cars and sets the stage for electric car charging and integration with the grid as will be discussed in a later chapter.
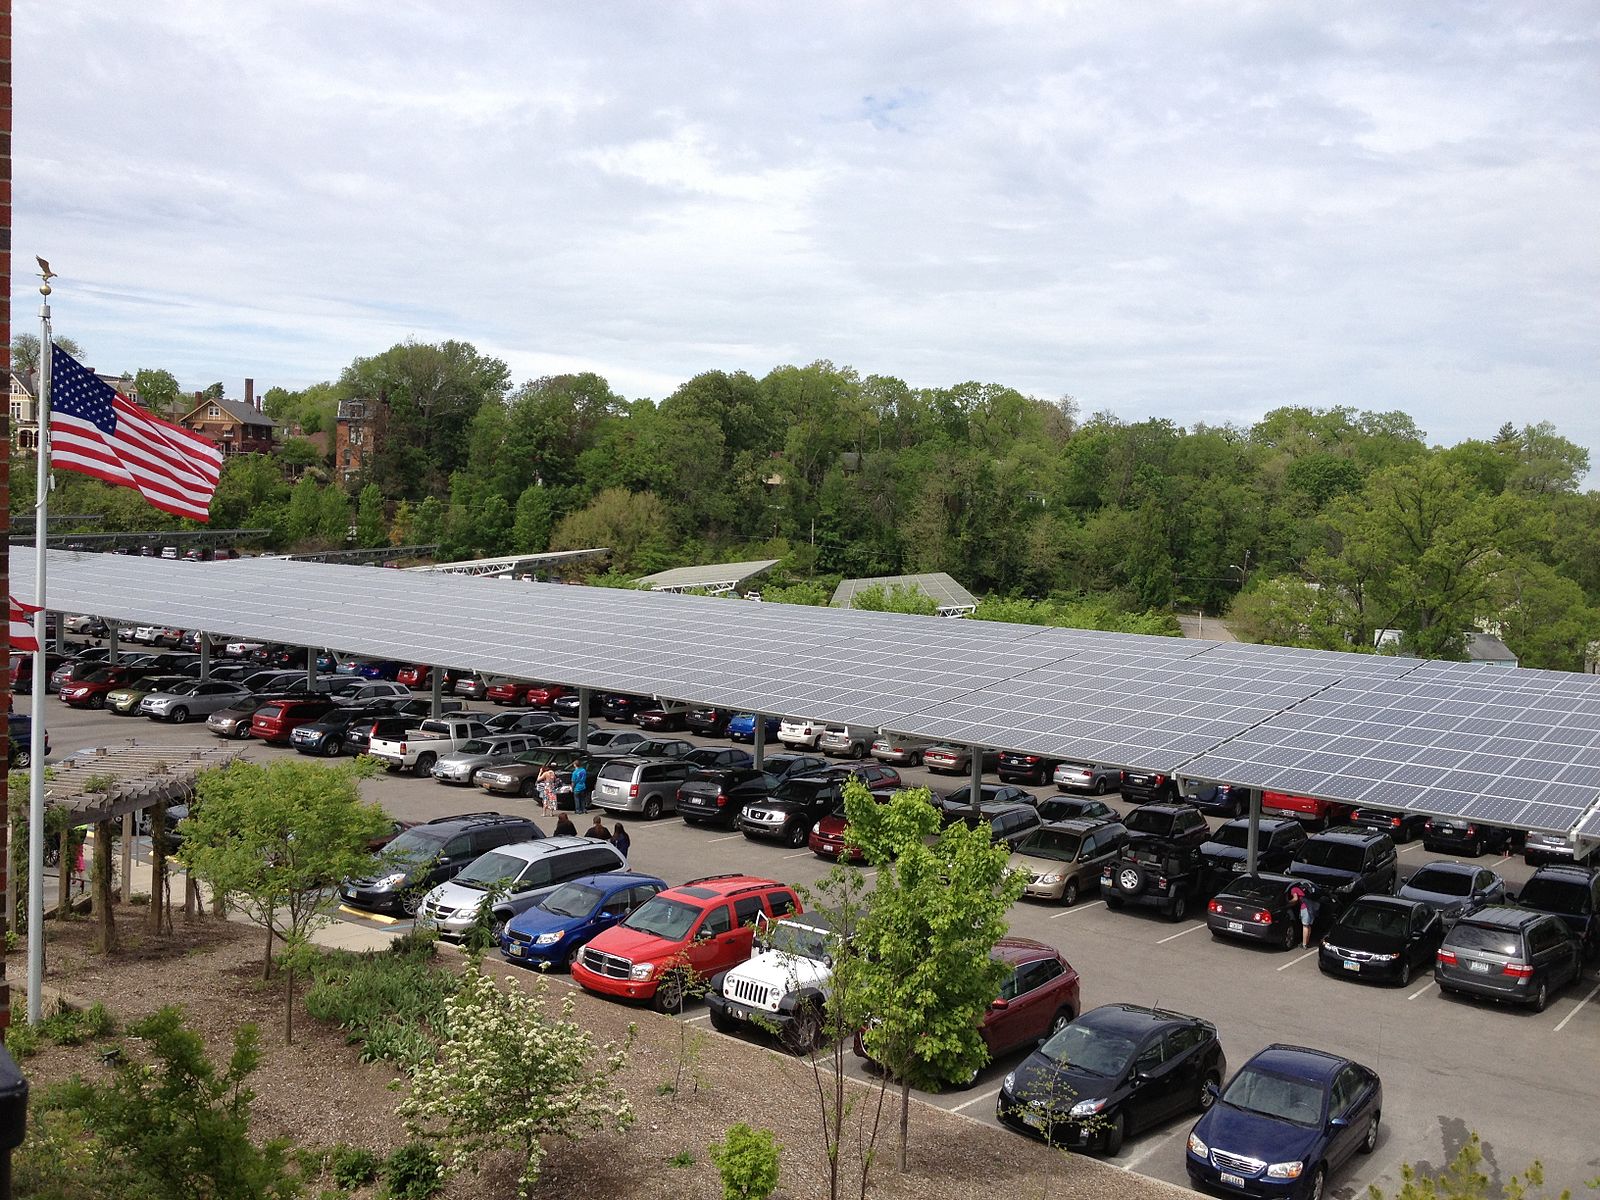
Figure 3.16: Solar panels in a parking lot at the Cincinatti Zoo. Source: https://commons.wikimedia.org/wiki/File:Solar_panels_at_cincinnati_zoo.jpeg
Some flat-panel arrays add 1-axis tracking to follow the sun throughout the day from east to west. A light sensor or computer sun movement model is used with small motors and gears to move the panels orientation throughout the day to maximize the energy generation. As mentioned before, this adds mechanical complexity and cost, but increases the average energy generated as seen in previous table of average daily solar insolation. When implemented properly, this can improve the payback times.
There are other designs that are employed for large utility scale products that will be mentioned briefly here, but not in detail due to the advanced technology. Three of the most common utility-scale technologies are shown in Figure 3.17. Parabolic trough systems use long parabolic reflectors to focus light on oil-filled pipes that run through the focal point of the parabola. These parabolic troughs are controlled to tilt toward the sun for focusing through the day (1-axis tracking). The oil inside of the pipes is heated to temperatures up to 750 {}F which makes steam to run conventional steam turbines and generators. Large parabolic solar arrays with capacities in the 200 – 300 MW range are operational in desert areas of California, Arizona, and Spain.
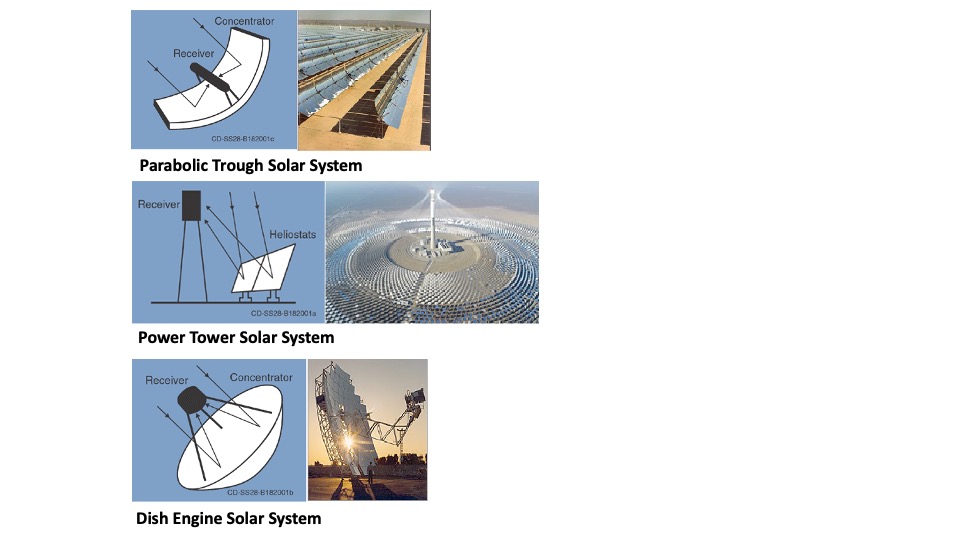
Figure 3.17: Utility Scale Solar Technologies. Source: https://solareis.anl.gov/guide/solar/csp/index.cfm, https://commons.wikimedia.org/wiki/File:50_MW_molten-salt_power_tower_in_hami.jpg#filelinks
Power tower systems use a large array of flat mirrors to track the sun and focus its energy onto a central receiver placed on a tall tower. These systems often have 2-axis tracking to maximize energy collection. The concentrated sunlight heats a fluid, often as molten salt, to temperatures above 1,000 \(^{\circ}\)F. The molten fluid has a high heat capacity and can be used to make steam for electricity generation. Alternatively, since molten salt has a high heat capacity the heat can be stored for days before being converted into electricity. This energy storage acts like a battery and allows the solar energy to be used at night or on days which are cloudy. As an example, the Ashalim solar power tower in Israel has an installed capacity of 121 MW with over 50,000 computer-controller mirrors.
Dish solar heat-engine systems are similar 2-axis trackers but instead use large-mirrored dishes to focus and concentrate sunlight onto a receiver mounted at the focal point of the dish. To capture the maximum amount of solar energy, the dish assembly tracks the sun across the sky. The receiver is integrated into a high-efficiency heat engine, alternatively called a Stirling Engine, with sealed tubes containing gases which expand upon heating and then condense during cool to drive pistons which generate electricity rather than mechanical energy in a combustion engine. Dish systems have smaller capacity, 3 to 25 kW, than the other large-scale systems but have the advantages of being modular and multiple dishes can be connected to create a larger system.
3.1.2.4 Solar Heating
While generation of electricity with solar PV panels is what most people think about when solar energy is mentioned, the energy from the sun can also be used for heating. The most common technology for active solar heating is solar water heating. A simple version of this is just a plastic bag of water set out in the sun to heat up for a warm shower later at a campsite, for example. With some added sophistication and technology, this idea turns into active solar hot water heaters as shown schematically in Figure 3.18. Panels, which from a distance look similar to solar PV panels, are placed on the roof and water or heat-transfer fluid is directly heated by absorption of the sunlight. This heated water is connected to a typical hot water heater with a simple pump. The heater water is then stored in an insulated tank for use in household hot water applications. In locations with a high level of solar radiation, the sun can heat water in a hot water heater to temperatures typical of other electric or natural gas water heaters (120 - 140 \(^{\circ}\)F) which eliminates the need for any other heating source. In many locations, the sun is not this intense so backup heating is required over the course of the seasons. However, since the water input to most houses is in the 50 – 60 \(^{\circ}\)F range, any heating of the water from the sun will reduce the overall energy input required to get the hot water temperature up to the setpoint. For example, if 60 \(^{\circ}\)F input water can be heated to 100 \(^{\circ}\)F, approximately 50% less energy is needed to get to a setpoint of 140 \(^{\circ}\)F. Figure 3.19 shows two solar hot water panels on a residential rooftop between the double rows of solar PV panels.
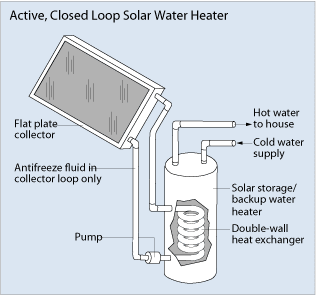
Figure 3.18: Solar heating schematic used on roofs to heat water for domestic use. Source: https://www.energy.gov/energysaver/solar-water-heaters
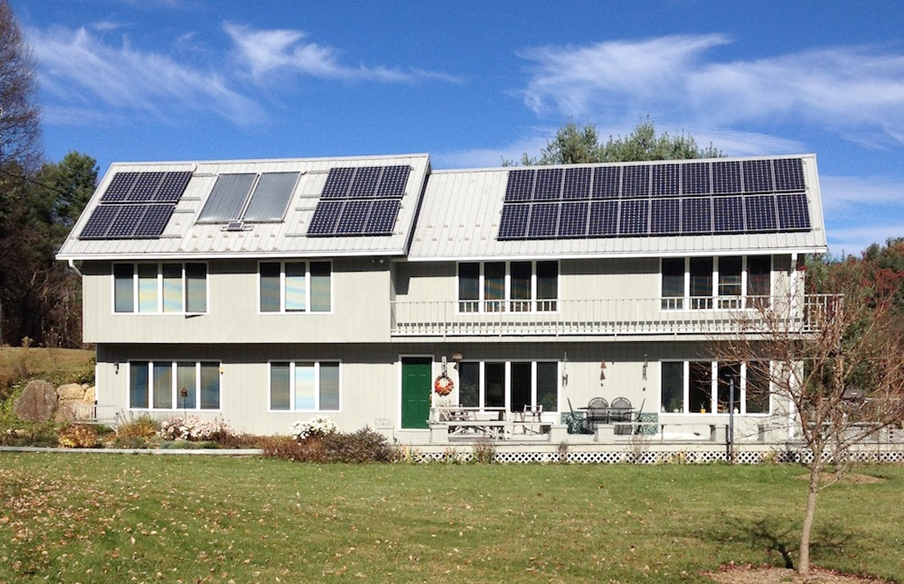
Figure 3.19: A house containing both solar panels and solar heating (larger gray panels). Source: www/solarconnexion.com
There are other types of solar hot water heating, both active and passive. Passive solar heating is also an option for building design as will be discussed in a later chapter on building systems. In these designs, buildings in cold climates are intentionally designed to absorb heat in the building materials such as the floors and the walls during the daylight hours and then slowly release this heat gain once the sun goes down and temperatures drop. This saves energy from other sources for heating of the building space.
The global warming crisis seems insurmountable at times. While there are approaches we’ve discussed regarding how to reduce carbon emissions, understanding the range of options available at this time can provide us with some hope. In fact, many of the technologies are in place already. For example, in the last chapter was an exercise looking at Carbon Capture and Storage (CCS). The objective was to estimate the reduction from capturing 90% of the carbon emissions for eight hundred (800) 1000 MW plants.
Let’s take a moment to backtrack and see where this comes from. The Carbon Mitigation Initiative developed an approach to visualize options to mitigate carbon by 8 billion tons of carbon per year by 2050. In their approach, they developed the stabilization wedges = that is 8 approaches that each account for 1 billion tons of carbon per year.
With this setup, read through this short National Geographic article to learn more about the wedges and options in front of us today. Arguably, our society is beginning to pay for the cost of carbon emissions, from the adverse human health impacts to climate-induced disasters (e.g., droughts, floods, forest fires). One of the points made in the article is that while we have the technology, we’ve not been paying the true cost of our collective choices. While we will not answer this directly in this class, it should be noted that some industries have benefited greatly from non-renewable energy and may be less interested in a renewable energy future.
3.1.3 Wind Energy
3.1.3.1 Introduction
Wind energy, fundamentally, is a form of indirect solar energy since wind is generated from temperature gradients which lead to pressure differences that drive the wind. The kinetic energy within the wind based on the mass and velocity of the air molecules is transformed into mechanical or electrical energy by the spinning blades. Windmills converted the energy in the wind to mechanical energy for purposes such as pumping water or grinding which were the early applications of this technology.
Wind turbines (Figure 3.20), a more advanced technology, convert the kinetic energy of wind into mechanical energy through rotating gears and then into electricity using a generator. Since the turbine spins at a particular speed depending on the wind speed, this generates alternating current at a specific frequency. To match the frequency needed for the electrical grid, further electrical conversion of the AC energy is done within the electrical control system of the turbine. Wind turbines also have sensors to measure the direction of the wind and adjust both the rotor and the blade angle to maximize the wind energy production in real time.
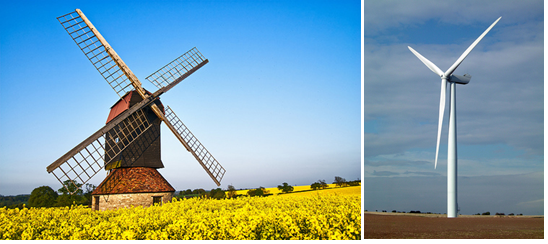
Figure 3.20: Traditional Wind Mill (left) and advanced large-scale wind turbine (right)
Like solar energy, wind energy is distributed non-uniformly across the globe. Unlike solar energy, wind speeds cannot be reliably predicted more than a few days in advance since it is strongly affected by weather. Wind is also more localized and affected by local geography.
The wind potential in the US for on-shore, off-shore, and the state of Virginia are shown in Figure 3.21. Note that these winds maps all specify the height for the potential wind resource because wind speed varies with height and designers must account for the wind resource at the actual design height for a given turbine design. You likely don’t know that weather forecasts from the National Weather Service give wind speeds for 10 meters, or almost 33 ft, above the ground. The variation of wind speed with height is shown in Figure 3.22 schematically. Empirical equations also exist to estimate the wind at different heights based on the wind speed at a known height. Off-shore wind turbines produce significantly more wind energy because the wind speeds are higher, the wind blows for more hours, and off-shore turbines can be more easily constructed at higher heights.
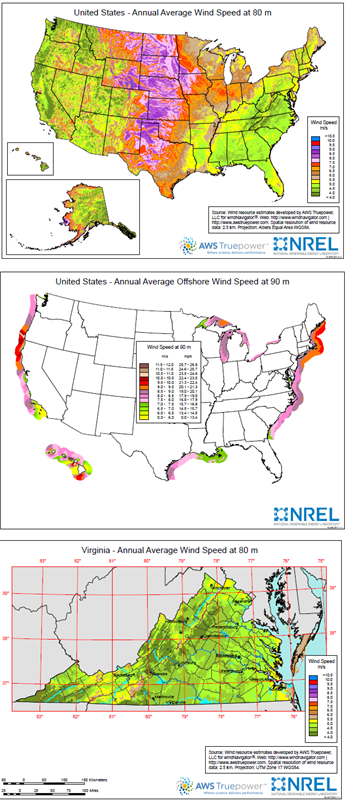
Figure 3.21: US land, US off-shore, and Virginia wind maps, annual average speed at 80m height. Source: NREL, https://windexchange.energy.gov/maps-data.
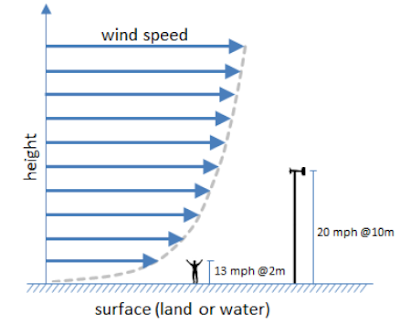
Figure 3.22: Wind Speed Varation with Height. Source: https://nwsreno.blogspot.com/2021/05/nws-wind-forecasts-aka-whats-deal-with.html
3.1.3.2 Efficiency and capacity factor
The efficiency of the wind turbine is the amount of energy in the input wind that can be captured and converted to output electricity - again the same efficiency equation used for fossil fuel power plants.
The capacity factor of a wind turbine is also defined the same as its actual energy output divided by its rated power capability over a given time period. In this case, the assumption that we made for the power plants that the output energy was mostly constant is no longer valid. The power output of a wind turbine is directly linked to the speed of the wind and its density. Therefore, the actual output of a turbine is the integral of the turbine power over time. This can be approximated by the sum of the Power multiplied by time (P x t) over a number of time intervals. Capacity factors for specific US wind projects built through 2016 are shown in figure 3.23 and the figure caption link allows you to interact with the graph for specific projects and locations. The important advantage of using capacity factors in wind energy calculations is that all of the power variation with time can be combined into a single factor which allows good estimates of total energy production over a given time.
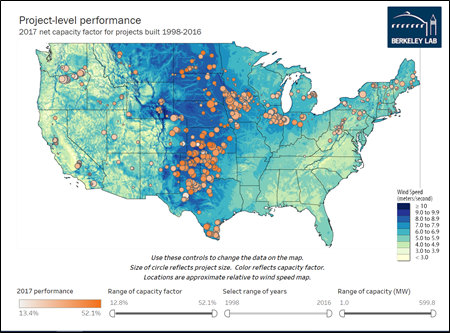
Figure 3.23: Capacity Factors for US On-Shore Wind Projects. Source: https://windexchange.energy.gov/maps-data/332
\[\begin{equation} Capacity Factor = \frac{E_{actualoutput}}{E_{rated}} \tag{3.5} \end{equation}\]
\[\begin{equation} Capacity Factor = \frac{\delta P \cdot t \partial t}{P_{rated}\cdot t} = \frac{\sum P_{i}\cdot t_{i}}{P_{rated}\cdot t} \tag{3.6} \end{equation}\]
3.1.3.3 Estimating energy from wind
Wind power curves for several General Electric (GE) wind turbine models are shown in figure 3.24 and show actual turbine power output as a function of wind speed. These wind turbines have a minimum power cut-on wind speed, in these cases 3 – 4 m/s, before any power is generated. This is the minimum wind speed required to overcome the friction and mass of the blades and rotor to start them rotating. The power produced then increases sharply with wind speed before becoming constant at high wind speeds. The upper power limit in these curves is the rated power, Prated, of the turbine. This is the maximum output of the turbine and is intentionally limited for safety and hardware lifetime issues. Above certain wind speed, the stress on the turbine blades and the wear of the gears/generators is too high. Therefore, under high wind speeds (15 m/s and higher in figure @ref(fig:knitr-wind7 ), the turbine blades are rotated to be parallel to the wind direction to minimize force and mechanical and electronic braking systems are applied.
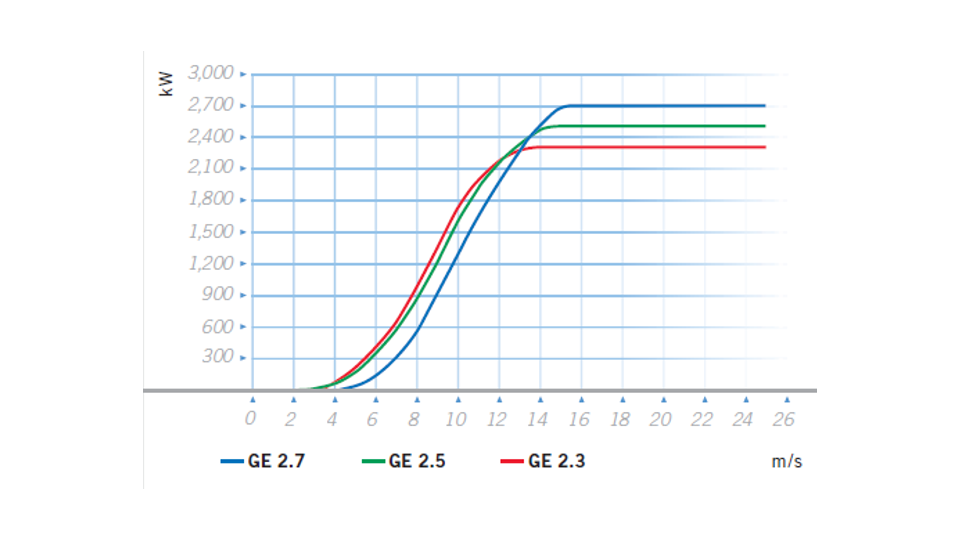
Figure 3.24: GE Wind Power Curves for 3 Different Turbine Models
The power of the wind turbine increases with the cube of the velocity between the cut-on and max power limits. This can be derived from the kinetic energy (KE) of the wind shown in equation (3.7).
\[\begin{equation} KE=\frac{1}{2}m\cdot v^{2} \tag{3.7} \end{equation}\]
Consider a cylindrical tube of wind with the same area, A, as the circle defined by the tips of the rotating turbine blades. This volume of wind defines the amount of kinetic energy available as the input “fuel” for the turbine. The length of this cylinder of wind over time, t, is defined by the velocity multiplied by the time. The volume of the wind in this cylinder over a length of time, t, (equation (3.8) can be combined with the density (equation (3.9)) to determine the mass of the wind (equation (3.10)) as shown below and substituted into the kinetic energy equation (equation (3.11)). This is the maximum amount of energy, or Ein, that is available for the turbine.
\[\begin{equation} V=A\cdot v\cdot t \tag{3.8} \end{equation}\]
\[\begin{equation} \rho =\frac{m}{v} \tag{3.9} \end{equation}\]
\[\begin{equation} m = \rho \cdot V = \rho \cdot A\cdot v\cdot t \tag{3.10} \end{equation}\]
\[\begin{equation} KE = \frac{1}{2} \rho \cdot A\cdot v\cdot t \cdot v^{2} = E_{in} \tag{3.11} \end{equation}\]
\[\begin{equation} \varepsilon _{wind} = E_{out}/E_{in} \tag{3.12} \end{equation}\]
\[\begin{equation} E_{out}=E_{in}\cdot \varepsilon _{wind} = \frac{1}{2} \rho \cdot A\cdot t \cdot v^{3} \cdot \varepsilon _{wind} \tag{3.13} \end{equation}\]

The wind efficiency, \[\varepsilon _{wind}\], considers all of the mechanical and electrical losses for converting the kinetic energy of the wind into electrical energy. These are shown schematically based on an older slide from GE in figure 3.25.
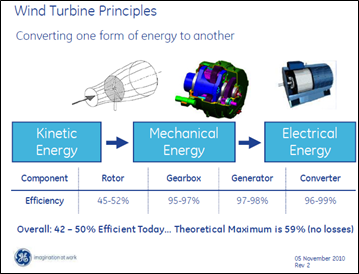
Figure 3.25: GE Wind Turbine Efficiency Schematic
Recalling that power equals the energy generation per unit time gives the equation (3.14) that explicitly shows the cubic dependence of wind turbine power on wind speed, v. This means that a doubling of the wind speed gives approximately 8 times for power (equation (3.14)):
\[\begin{equation} P=E_{out}/t= \frac{1}{2} \rho \cdot A\cdot v^{3} \cdot \varepsilon _{wind} \tag{3.14} \end{equation}\]
Note that the wind efficiency is sometimes denoted Cp and called the wind efficiency coefficient in some texts and references. Physics limits the output energy for a wind turbine to 59% of incident wind energy based on Betz’s Law which occurs under the conditions of v_{out}=v_{in}. One way to think about this physical limit without going through a full mathematical proof is to consider what it would mean for all of the input kinetic energy of the wind to be converted by a turbine. Removing all of the energy from a wind input would mean that velocity of the wind on the backside of a wind turbine would necessarily be zero and the turbine would stop spinning.
A real set of wind speed data for a full day and month is shown in the figure 3.26. This data is often simplified into a wind frequency distribution chart like the one shown in figure 3.27.
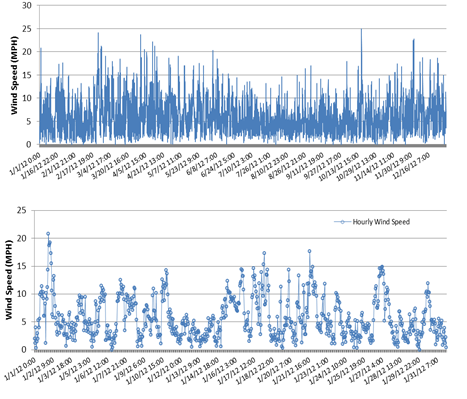
Figure 3.26: Wind speed hourly data for Twin Falls, ID (2012)
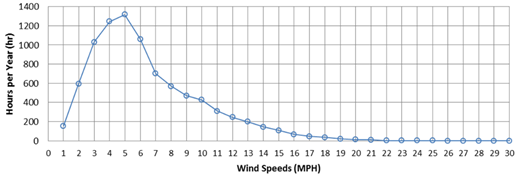
Figure 3.27: Wind Distribution chart for a year of Twin Falls, ID wind data (2012))
From Figure 3.27, the amount of power generated by the turbine can be determined at each wind speed using the turbine power curve, like in Figure 3.24. These power numbers must then be multiplied by the number of hours at each power and summed to get the actual power, Eactual, generated by the turbine in a year (or other time frame). Since we know the rated power of the turbine, Prated, this is how the capacity factor for a turbine is estimated. In practice, the wind speed from the wind maps shown earlier are not at high enough resolution and often at the wrong height for a specific project. Therefore, wind speed measurements in new locations are generally measured for a full year using an anemometer at a height close the turbine design height. Shorter time measurements are risky since wind speeds are generally variable by season and a few months of data often gives a capacity factor which is an over- or under-estimate compared to a full year measurement.
Wind measurements also need to consider the wind’s direction. Even though modern turbines can track the wind and adjust the turbine direction to maximize wind capture, the predominant wind direction is important for siting of turbine arrays. The example below with Figure 3.28 shows a Wind Rose which plots both wind speed and direction of the wind for a specific site.
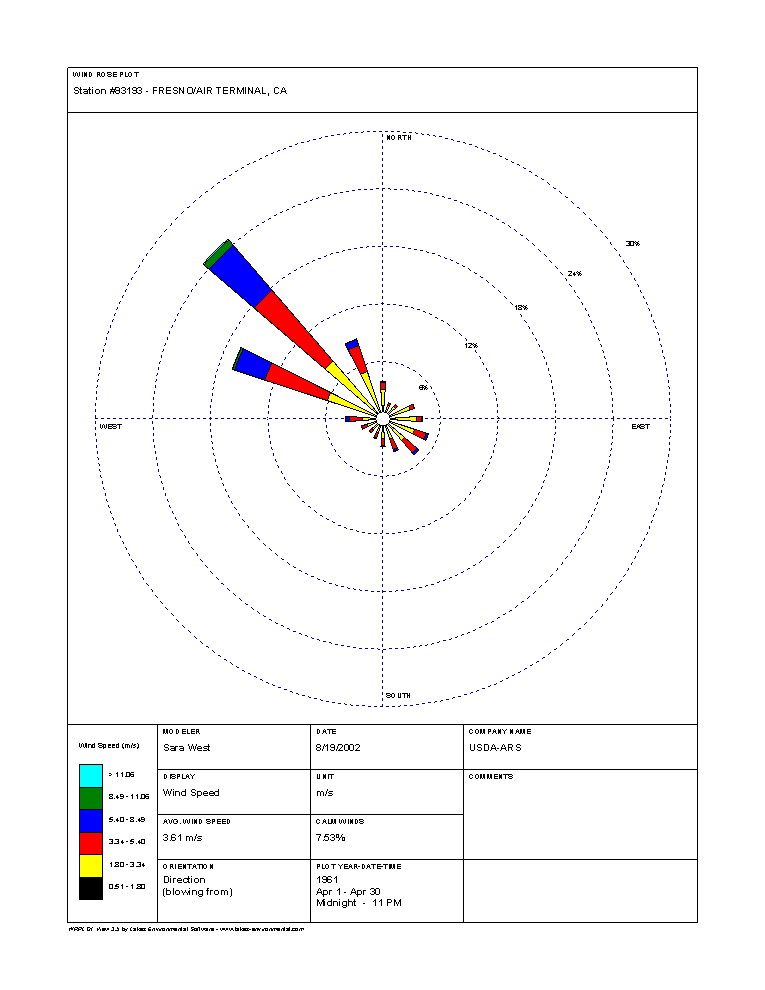
Figure 3.28: Weibull Wind Speed Distribution. Source: https://www.nrcs.usda.gov/wps/portal/wcc/home/climateSupport/windRoseResources/windRoseExample
The data in figure (ref?)(fig:knitr-wind11) shows 30 years of winds in the month of April for Fresno, CA from 1961-1990. This data plotting method visually shows that these winds blow mainly from the northwest (NW) and rarely from other directions. From the radial distance from the center, one can quickly estimate that 50% of all wind comes from the NW, WNW, and NNW.
The color coding and legend on the wind roses also provide details on the distribution of speeds at each directions. For the predominant wind direction, NW, approximately 8% of the time wind blows at speeds from 1.8 - 3.34 m/s, 10% of the time from 3.34 - 5.4 m/s, 6% of the time from 5.4 - 8.49 m/s, about 1% of the time from 8.49 - 11.06 m/s, and less than 0.5% of the time at speeds greater than 11.06 m/sec.
The legend at the bottom also gives the average wind speed for the month over all hours, in this case 3.61 m/sec, and calm winds for 7.5% of the time.
When full year wind measurements are not available, mathematical models can be used in some cases. Wind speeds typically follow a Weibull Distribution as shown in figure 3.29. In this case, f(x) is the probability distribution of the wind speed, x, where k is the shape parameter, and is known as the scale parameter.
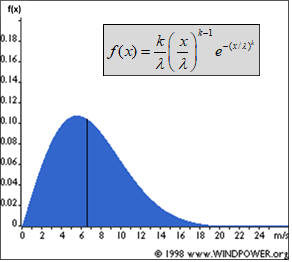
Figure 3.29: Weibull Wind Speed Distribution. Source: https://www.nrcs.usda.gov/wps/portal/wcc/home/climateSupport/windRoseResources/windRoseExample
The Capacity factor is directly related to the amount of energy that can be produced and the energy revenues that can be generated. Projects with low capacity factors will be less profitable. On-shore in the range of 25 – 30% are considered reasonable and over 40% is considered excellent. Off-shore winds are generally stronger than on land, and the turbines are higher, leading to higher capacity factors which can exceed 50%. Since wind developers try to maximize profit, the sites with the highest projected capacity factors will be developed first and later projects often have lower energy production.

Figure 3.30: Block Island Wind Farm
Exercise
Problem statement:
Block Island is the US first off-shore wind project. It has of 5 turbines with a rated power of 6 MW each.
Part 1. How much electrical energy (MWh) can these turbines generate in a year if the capacity factor is 48%?
Eproduce = n x P x CF x t
Eproduce = 5 x 6 MW x 0.48 x 8,760 hrs/yr
Eproduce = 126,000 MWh/yr
Part 2. If the average house in this region uses 7,500 kWh in electricity per year (RECS survey - https://www.eia.gov/consumption/residential/), how many houses can this wind farm supply electricity for annually?
Eproduced = #houses x Econsumed
rearrange equation
houses = Eproduced / Econsumed
houses = 126,000 MWh/yr / (7,500 kWh/yr x 1 MWh/1,000 kWh)
houses = 16,800 houses assuming 100% energy transmission
This is simplified slightly since there would be some energy transmission loss between the turbines and the houses on the island.
Part 3. Block Island was previously powered by 5 large diesel generators which burned approximately 1 million gallons of diesel fuel (137,400 BTU/gallon and 160 lb CO2/MMBTU) every year. The island is now powered entirely by these 5 turbines. 10% of the turbine wind energy goes to Block Island while the other 90% goes to the New England regional electricity grid (NEWE). The carbon emissions coefficient for the NEWE regional grid electricity is approximately 500 lb CO2/MWh. How many tons of CO2 are avoided per year due to this switch to renewable energy?
Given:
Vfuel = 1 x 10⁶ gallons
pfuel energy = 137,400 BTU/gallon
ECfuel = 160 lb CO2/MMBTU
Turbinesnumber = 5
%EBlockIsland = 10%
%ENewEngland = 90%
ECgrid = 500 lb CO2/MWh
Solution step 1: Calculate CO2 fuel and emissions savings
CO2 fuel = Vfuel x \(\rho\)fuel energy x ECfuel
CO2 fuel = 1 x 10⁶ gallons x 137,400 BTU/gallon x (1 MMBTU / 1 x 10⁶ BTU) x 160 lb CO2/MMBTU x (1 ton / 2,000 lb)
CO2 fuel = 10,992 ton CO2 yr-1
Solution step 2: Calculate regional grid CO2 savings
equation 1: ENewEngland = 90% x Eproduced
equation 2: CO2 grid = ECgrid x ENewEngland
sub equation 1 into 2:
equation 3: CO2 grid = ECgrid x 90% x Eproduced
CO2 grid = 500 lb CO2/MWh x 0.90 x 126,000 MWh/yr x (1 ton / 2,000 lb)
CO2 grid = 28,350 ton CO2 yr-1
The total reduction is simply the sum of the grid and fuel savings (ignoring any maintenance emissions):
CO2 total = CO~2 fuel~ + CO~2 grid~
CO2 total = 10,992 ton CO2 yr-1 + 28,350 ton CO2 yr-1
CO2 total = 39,342 ton CO2 yr-1
Exercise: Students are often interested in replacing the VT steam power plant with renewable energy. What would that look like using local wind turbines?
Part 1. How many wind turbines are required to replace energy provided by just the VT on-campus power plant? Assume a wind turbine power rating of 3 MW, a capacity factor of 30%, and a transmission loss from the wind farm to campus of 3%. The the on-campus power plant provided approximately 13,200 MWh/yr to campus in 2023.
Part 2. How many of these wind turbines would be required to generate all of the VT energy (on-campus + utility)? The total electricity consumption on campus was 184,000 MWh/yr in 2023. Assume the same energy needs and transmission loss.
Part 3. What do you think is the biggest barrier to implementation of this plan in Blacksburg?
3.1.4 Hydropower
3.1.4.1 Introduction
Hydropower energy systems use the kinetic energy of flowing water to spin a turbine and generate electricity. This renewable energy source is also considered indirect solar energy since the water cycle which supplies streams, rivers and lakes with water is driven by the sun. Like wind power, hydropower energy has been used for centuries and the technology has rapidly improved in the 20th century. Prior to efficient turbines for electricity generation, hydropower was used to turn paddle wheels on rivers to grind grain and process lumber. Electricity was first generated in the US using hydropower in the 1880s.
China has the largest installed hydropower capacity and is also adding the most new hydropower energy systems as seen in Figure 3.31. Worldwide, approximately 16% of electricity comes from hydropower. Most people in the US are surprised that number of countries in Africa and South American get more than 50% of their electricity from hydropower; the Central African Republic, Lesotho, Paraguay, the Democratic Republic of Congo, Albania, Nepal, Ethiopia, Tajikistan, Uganda, Zambia, Kyrgyzstan, and Norway get more than 90% of electricity from hydropower. Figure 3.32shows this graphically and the online map from Our World in Data is interactive.
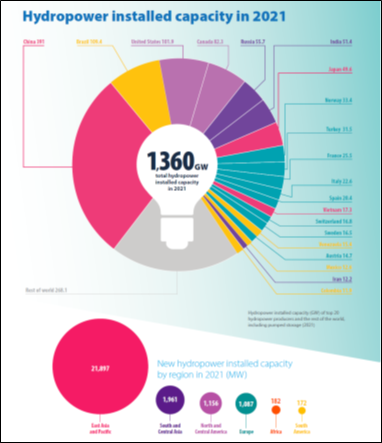
Figure 3.31: Worldwide hydropower capacity, 2021. Source: International Hydropower Association Limited, Hydropower Status Report, 2022
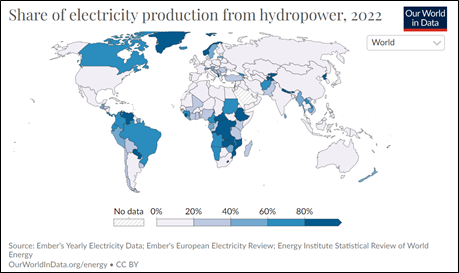
Figure 3.32: Share of electicity production from hydropower, 2022. Source: https://ourworldindata.org/grapher/share-electricity-hydro
The US gets approximately 6% of its electricity from hydropower. About half of this energy is generated in California, Washington, and Oregon. The US hydropower system is fully developed with few new hydropower plants being built. This is a result of the best hydropower locations already being used and restrictions due to environmental and community concerns. Figure 3.33 shows US hydropower plants by location, size, type of plant. The largest US. electric power plant is the Grand Coulee hydro dam on the Columbia River in Washington with a capacity of 6,765 MW more than 6 times larger than a large fossil fuel power plant. In comparison, the Three Gorges Dam on the Yangtze River in China is the largest hydropower plant in the world with a generating capacity of 22,500 MW. This dam creates the Three Gorges Reservoir, which has a surface area of approximately 400 square miles and extends upstream from the dam about 370 mile. This hydropower system can produce more than 100 billion kWh of electricity annually.
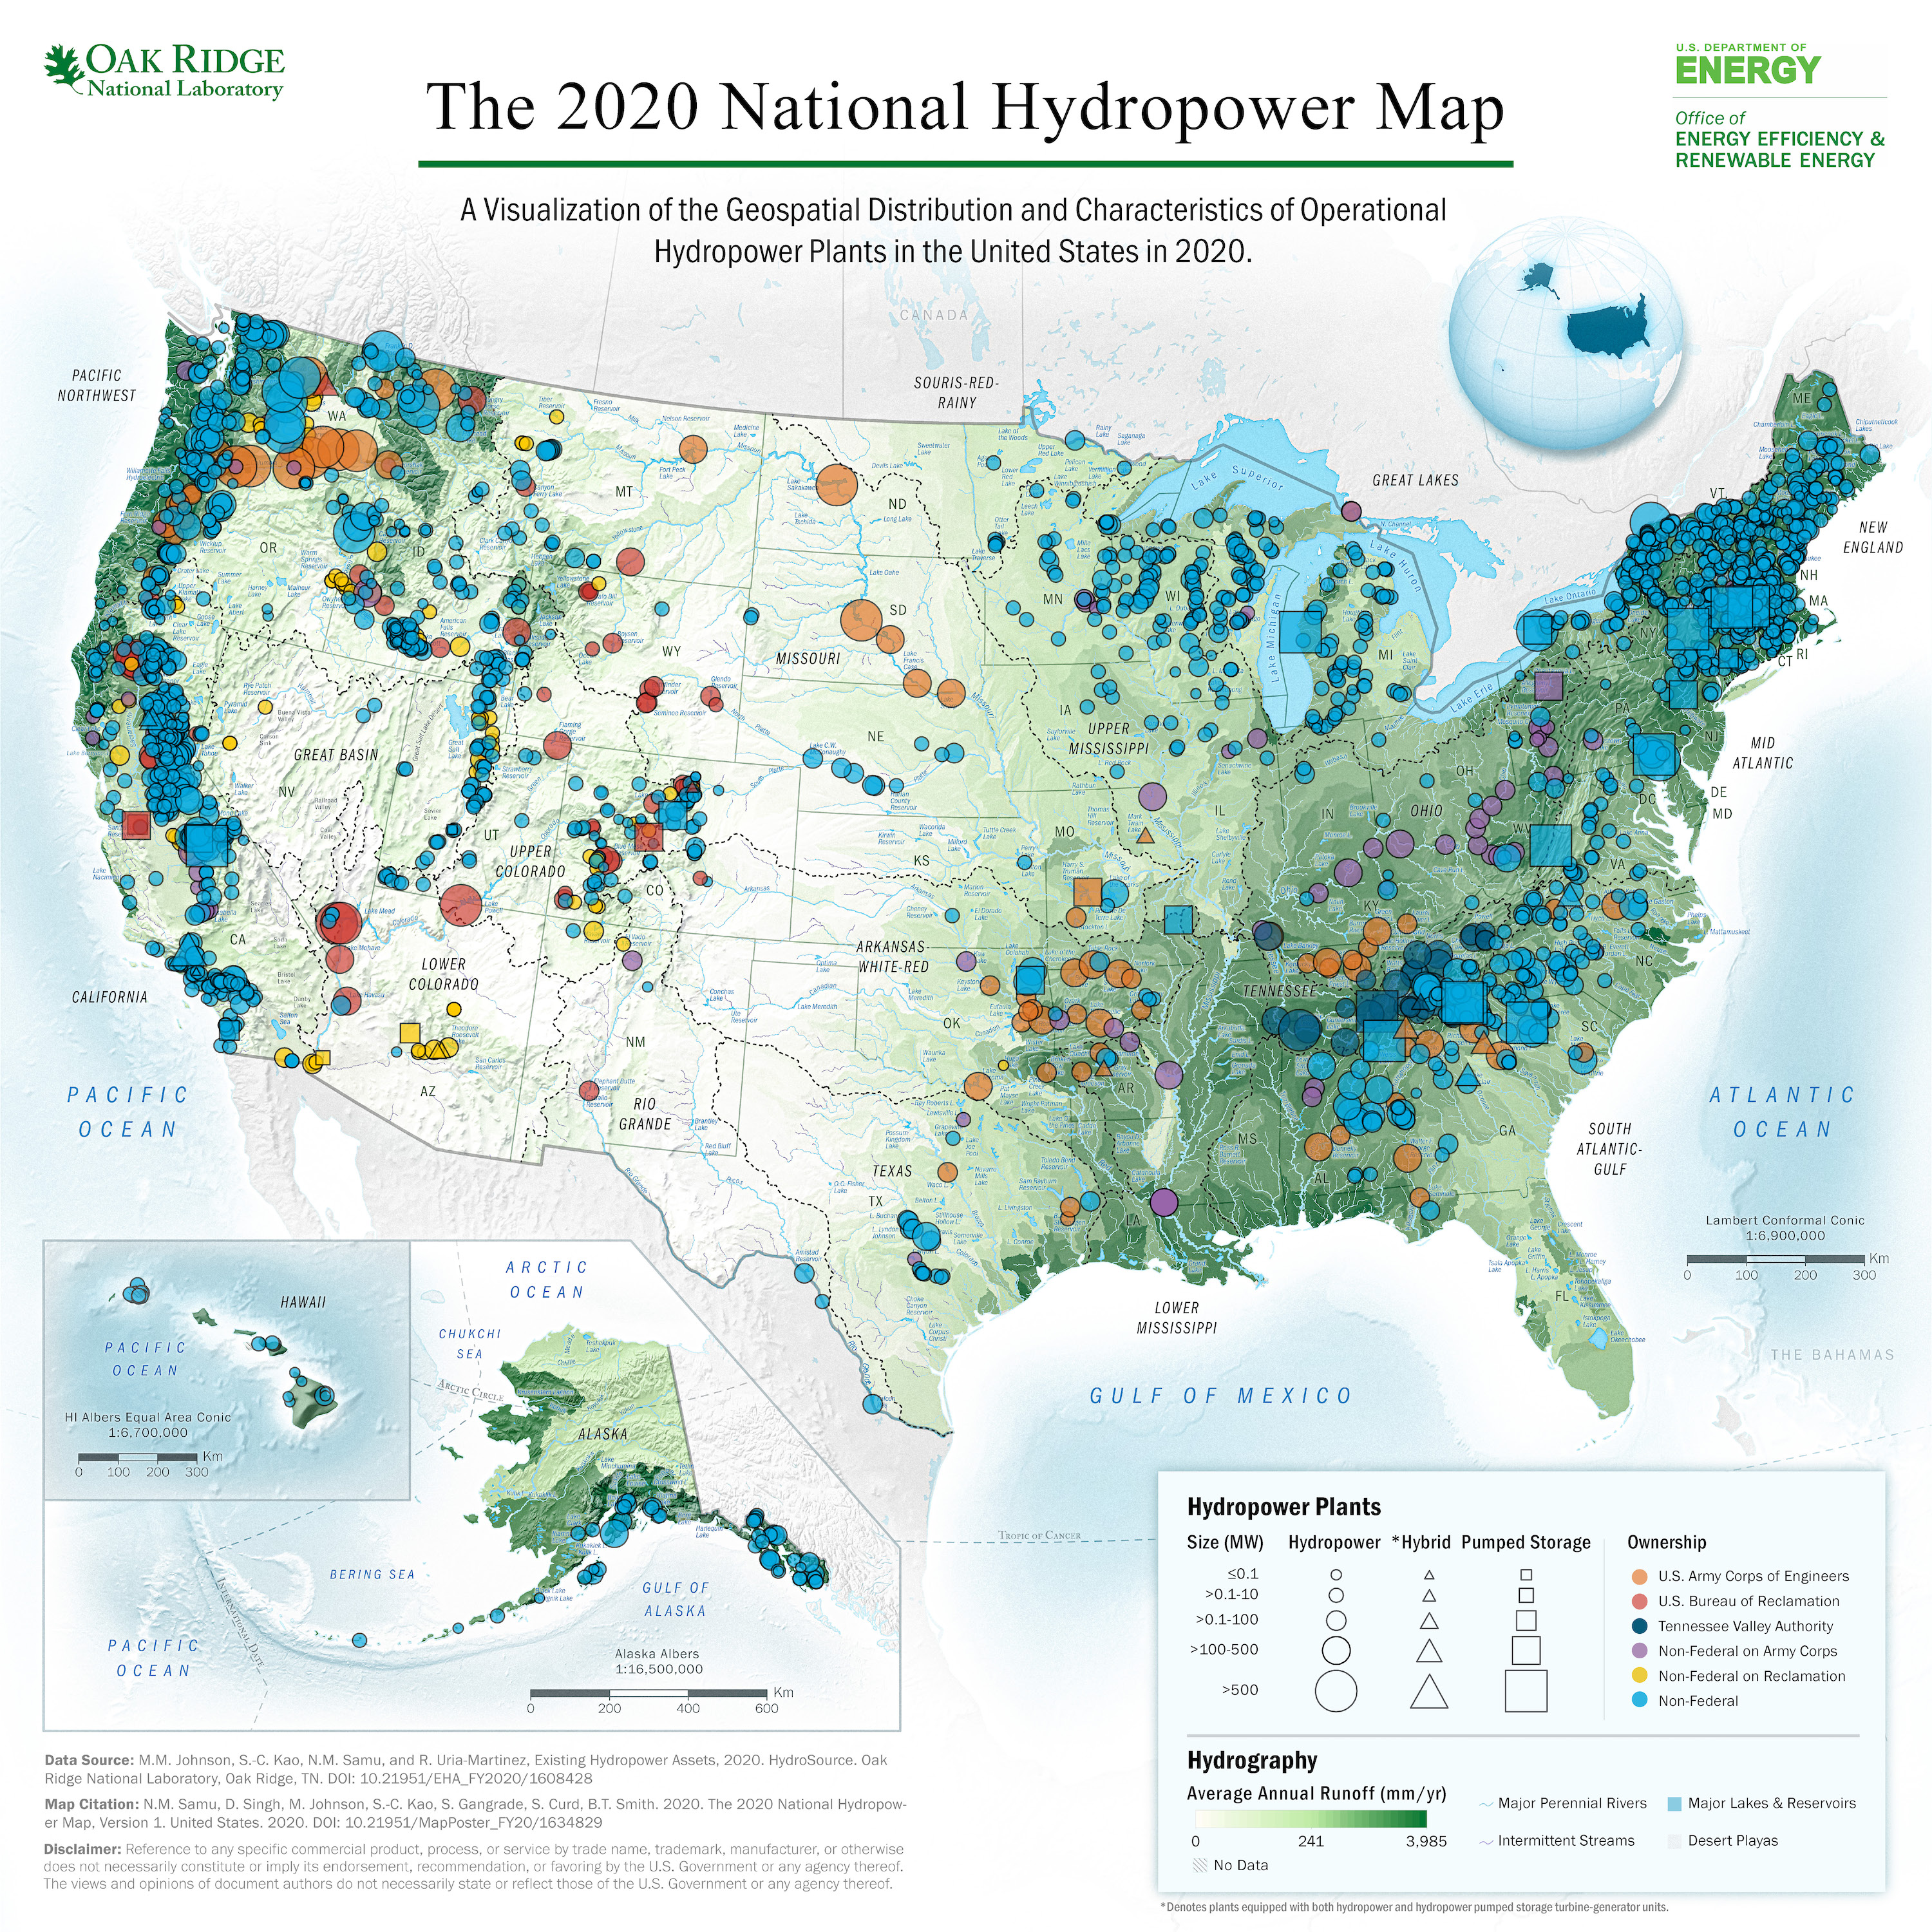
Figure 3.33: The 2020 National Hydropower Map. Source: https://hydrosource.ornl.gov/map/2020-national-hydropower-map
3.1.4.2 Types of hydropower
The most common type of hydroelectric power plant is an impoundment facility. In this system, river water is stored in a large reservoir behind a dam (figure 3.34). Water released from the reservoir flows through a turbine which spins and a generator produces electricity. The flow of water is controlled by by large gates or valves as necessary to meet electricity demands and other needs including flood control, recreation water levels, and water quality.
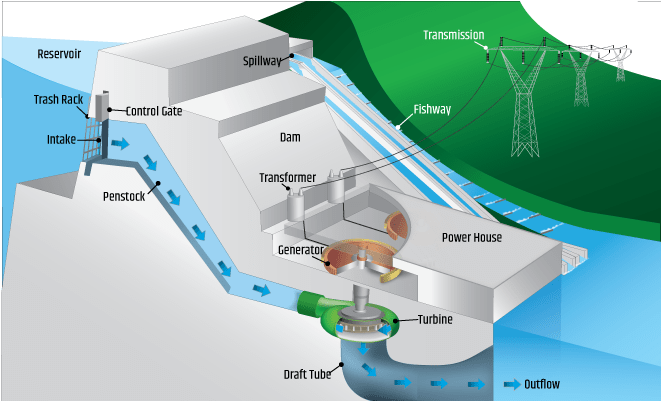
Figure 3.34: Impoundment Hydropower System. Source: https://www.energy.gov/eere/water/types-hydropower-plants
Diversion hydropower systems divert some fraction of the main river or stream which flows through a penstock, turbine, and generator much like the impoundment systems. This is shown in Figure 3.35. The exit water from the system joins the main river downstream. These systems are sometimes called “run-of-river” facilities and utilize the natural elevation decline of the river for energy.
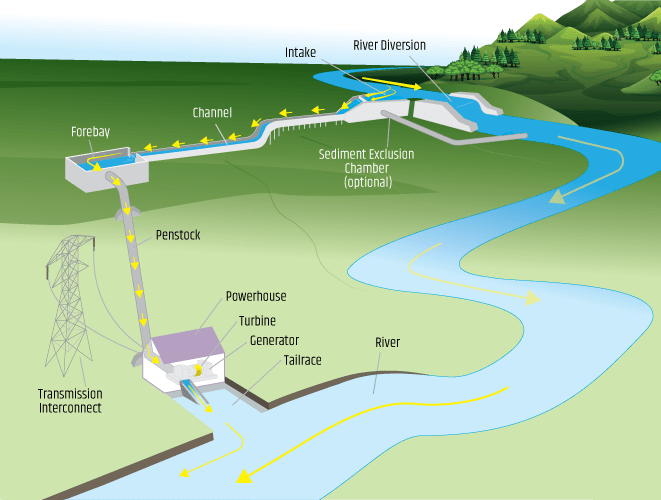
Figure 3.35: Diversion Hydropower System. Source: https://www.energy.gov/eere/water/types-hydropower-plants
In-stream or in-river hydropower systems use the natural kinetic energy of the flow of the river with a turbine located directly in the river or stream without a dam or river diversion infrastructure. Most of these are smaller systems on farms or other rural facilities. Because the turbines are directly in the river or stream, the capacity factor may be affected more by seasonal changes in flow than impoundment systems or large rivers which have more water and don’t have this variation.
3.1.4.3 Calculations
In all of these systems, the hydropower energy comes from the kinetic energy of the water. For a dam and reservoir in which the water has no initial velocity, the kinetic energy is limited by the potential energy (PE) due to elevation difference or height (h) in equation (3.15). Power is given by this kinetic energy divided by time (equation @ref(eq: Pthydro1)) and water density simplifies the power further (equation (3.17)). The practical form of the equation uses the volumetric flow rate (V/t) (equation (3.18)). Here, (V/t) is most commonly referred to as streamflow (Q), which in the US is in units of gallons per minute or cubic feet/second of the water flowing through the hydropower plant and turbine.
\[\begin{equation} E_{potential} = m \times g \times h \tag{3.15} \end{equation}\]
\[\begin{equation} P = \frac {E}{t} = \frac {m \times g \times h}{t} \tag{3.16} \end{equation}\]
\[\begin{equation} P = \frac {m}{t} \times g \times h = \rho \times \frac {V}{t} \times g \times h \tag{3.17} \end{equation}\]
\[\begin{equation} P = \frac {V}{t} \times \rho \times g \times h \times \varepsilon_{hydro} = Q \times \rho \times g \times h \times \varepsilon_{hydro} \tag{3.18} \end{equation}\]
The efficiency of these systems depends strongly on capacity of the hydropower plant which gets more efficient with size. This efficiency varies from 50% in small systems, which are often dominated by piping losses, up to 90% in large plants.
Hydropower systems can also be pumped-hydropower in which water can be pumped backward through the system to add water to the reservoir. This type of system acts much like a battery so a more detailed description is left until the next chapter.
Exercise. Claytor Lake
Despite the relatively high amount of coal used by Appalachian Power Company (APCO), the main utility in southwest Virginia, it does have several hydroelectric power plants including Claytor Lake near Christiansburg and Smith Mountain Lake a little bit south of Roanoke.
The Claytor Lake dam on the New River was completed in 1939 and has a capacity of 75 MW. The 4 turbines in the dam each have 16-foot-diameter penstocks and a total hydraulic capacity of 10,000 cubic feet per second (cfs).
Using equation above and a hydropower plant efficiency of 90%, calculate the number of hours of water flow through the Claytor Lake dam that are needed to match a VT campus power plant energy requirement of 25,000 MWh/yr. Use the current flow rates and height from the American Electric Power website, Hydro Plant Levels and Flows website. The height (h), or Head, is the difference between the upper (Forebay) and lower (Tailwater) water reservoir elevations on upstream and downstream sides of the dam, respectively. This hydropower data on this website is updated every 15 minutes.
Also estimate the total energy generation of this hydropower facility if the capacity factor is 30%.
3.1.5 Geothermal
3.1.5.1 Introduction
Geothermal power plants use hot water and steam from below the surface of the earth to generate electricity in large-scale power plants. This energy comes from the inherent thermal energy in the earth and is therefore renewable. We will briefly mention some geothermal basics, but will not cover this topic in as much detail as the previous renewable energy sources since the technologies and design considerations are more complex.
For efficiency, geothermal power plants require high-temperature hydrothermal resources in the 300 – 700 range from either dry steam wells or from hot water wells. Drilling technologies are required to access and then pipe this energy to the surface to power a turbine that generates electricity. This type of geothermal energy for electricity production is different from geothermal heat pumps which use the consistent temperature of the ground (50 – 60 °F) to transfer heat into and out of (air conditioning) buildings. This building application will be discussed in much more detail in a later chapter.
According to the US Department of Energy, an estimate of 90 - 300 GW of geothermal electrical power capacity in the continental US is projected to be available by 2050. Taking advantage of this resource could account for up to 10% of current US. electricity capacity and be 20 - 75 times the current installed geothermal capacity. Nonetheless, the US currently has the most installed geothermal electricity capacity at almost 4000 MW. Figure 3.36 shows the distribution of US Geothermal Resources.
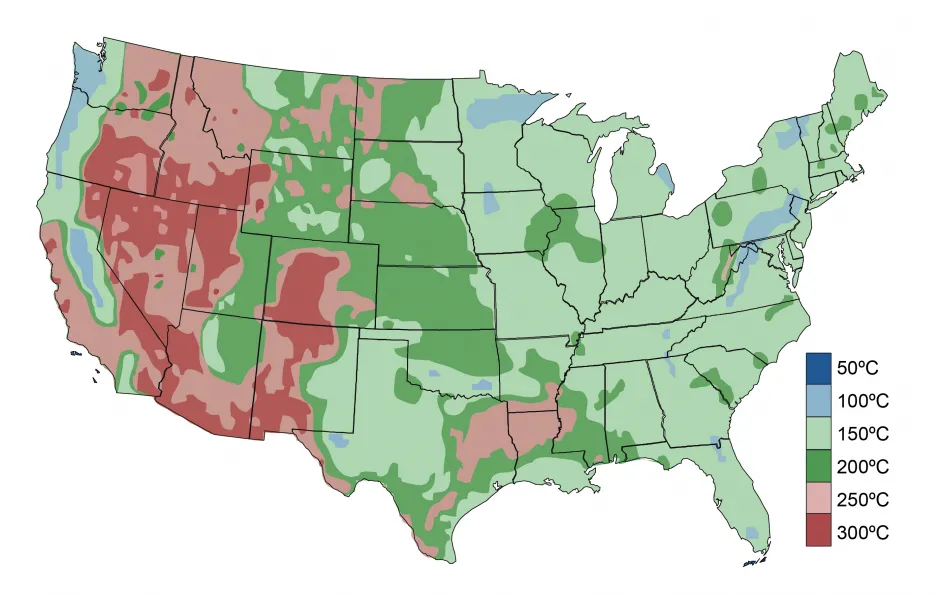
Figure 3.36: Geothermal resources across the US. Source: https://css.umich.edu/publications/factsheets/energy/geothermal-energy-factsheet
3.1.5.2 Types of geothermal
There are 3 main types of geothermal power plants. All of them use hot steam in slightly different ways from the earth to turn a steam turbine and generator to produce electricity. The US Office of Energy Efficiency and Renewable Energy (Energy) has good dynamic graphic to show in more detail how these systems work.

Figure 3.37: Geothermal plant diagram. Source: https://www.eia.gov/energyexplained/geothermal/geothermal-power-plants.php
While these schematics make geothermal energy seem like an easy energy resource, the technology for these power plants is complex and has many difficult engineering challenges. The piping that carries the steam and hot water from deep underground to the power plant is subject to severe corrosion potential both due to the high temperatures and corrosive chemicals within the water. The water also contains dissolved carbon dioxide and hydrogen sulfide gases which must be captured at the surface to avoid other environmental issues.
Exercise. The Geysers Geothermal Complex (https://geysers.com/)
The Geysers, about 75 miles north of San Franciso, CA, is the largest complex of geothermal power plants in the world. It consists of 13 power plants with net generating capacity of about 725 megawatts of electricity - enough to power 725,000 homes, or a city the size of San Francisco. Some data about this complex is provided below for scale.
This site has expanded and energy demand is higher than the available original steam reservoir. Today, sustainable power generation relies on two large-scale wastewater injection projects from Lake County and the City of Santa Rosa. Together, these projects provide approximately 20 million gallons of reclaimed water per day for injection into The Geysers reservoir. The vast amount of heat in reservoir rocks efficiently converts the water into steam and supplements the production of original reservoir steam to Geysers power plants
Geothermal Wells
-
19 steam wells
-
73 injection wells
-
Deepest well: 12,900 feet, or over two miles
-
Average well depth: 8,500 feet
-
Total Geysers wells drilled to date: 601
-
Average Drilling Time: 85 days
-
2022 average steam production per well: 12,000 lb/hr
-
Average Reservoir Steam Temperature: 370.9 °F
-
Average Flowing Steam Pressure: 83.2 PSIG
Facilities
-
13 operating geothermal plants
-
Steam pipelines: 92.2 miles
-
Injection water lines: 72 miles
-
21kV power lines: 75 miles
-
Project roads: over 171 miles
Water Injection
- Two large-scale wastewater injection projects provide an average 15 million gallons daily (MGD)
Power Generation
-
First commercial power plant: Unit 1, Startup - September 1960
-
Most recent plant built: Aidlin, 1989
-
2022 Average Load: 631 MW
-
2022 Generation: 5,544,000 MWh
-
2022 Average Unit Availability (Capacity Factor): 91.2%
3.1.6 Wave and Tidal Systems
3.1.6.1 Introduction
Wave or tidal power works on similar principles to the more traditional hydropower energy systems just described. These tidal systems are not dependent on the water cycle but rather depend on the moon’s gravitational pull. There are many different technologies currently in research and practice to capture the energy in tides. These systems vary both in their location in the water as shown in the schematic of Figure 3.38 and in the technology used to convert the kinetic energy of the water to electrical energy. Several of these technologies are mentioned in this section, but many others which will not be discussed here are in the early research and development phase. Globally, tidal power is estimated to potentially produce 150 - 800 terawatt hours (TWh) of renewable energy per year. The upper end of this estimate is roughly equal to [one-quarter of all US renewable energy production in 2022(https://www.scientificamerican.com/article/tidal-power-faces-a-fickle-future-with-rising-seas).
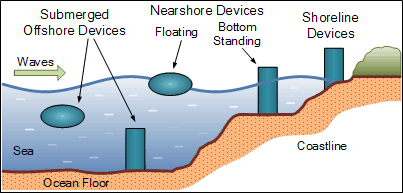
Figure 3.38: Water power options. Source: https://www.alternative-energy-tutorials.com/wave-energy/wave-energy.html
3.1.6.2 Types and Examples
Sea turbines work like wind turbines, but in a flow of water in a river or a steady ocean current like the Gulf Stream. The technology is much like an inverted wind turbine, but the challenges of underwater construction and maintenance as well as the corrosive nature of water, especially salt water, make these systems much less common. The energy equation for these systems is the same as for wind turbines in equation (3.19). However, now the power and energy for the water turbine can be large despite a much smaller blade area and water speed since the density of water is one the order of 750 times larger (1000 kg/m3 for water vs. 1. 3kg/m3 for air).
\[\begin{equation} E_{out} = E_{in} \times \varepsilon = 0.5 \times \rho \times A \times t \times V^{3} \times \varepsilon_{turbine} \tag{3.19} \end{equation}\]
Recently, prototype water turbines shown above the water in Figure 3.39 have been tested in New York City’s East River, which has the advantage of the strong water currents that change direction between flood and ebb tides four times each day.

Figure 3.39: Water Turbine Test Rig (100 kW) for the East River in New York City. Source: https://www.energy.gov/eere/water/articles/tidal-testing-underway-new-yorks-east-river
Another type of tidal energy system uses a structure like a dam called a barrage which is constructed across an inlet of an ocean bay or lagoon that forms a tidal basin. This system uses the natural two-way tidal cycles to generate electricity from both the incoming and outgoing tides. As seen in Figure 3.40, sluice gates on the barrage control water levels and flow rates to allow the tidal basin to fill on the incoming high tides and to empty through an electricity turbine system on the outgoing ebb tide.
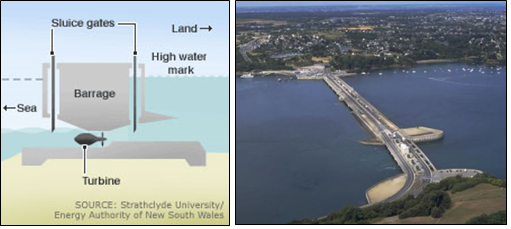
Figure 3.40: Tidal Barrage Schematic and the La Rance Tidal Power Station. Source: https://energyeducation.ca/encyclopedia/Tidal_barrage, https://tethys.pnnl.gov/project-sites/la-rance-tidal-barrage
The La Rance Tidal Power Station in Brittany, France, on the Rance River is the world’s second biggest tidal power station with 24 turbines and a peak rating of 240 MW. Its capacity factor is approximately 40%. The barrage is almost a mile long, with the advantage of carrying cars across it on the roadway on the top. This system was the world’s first major tidal power station when it opened in 1966. A potential disadvantage of tidal power is the effect a tidal system can have on plants and animals in estuaries of the tidal basin since the water flow is controlled to some degree and not natural.
3.2 Biomass and Biofuels
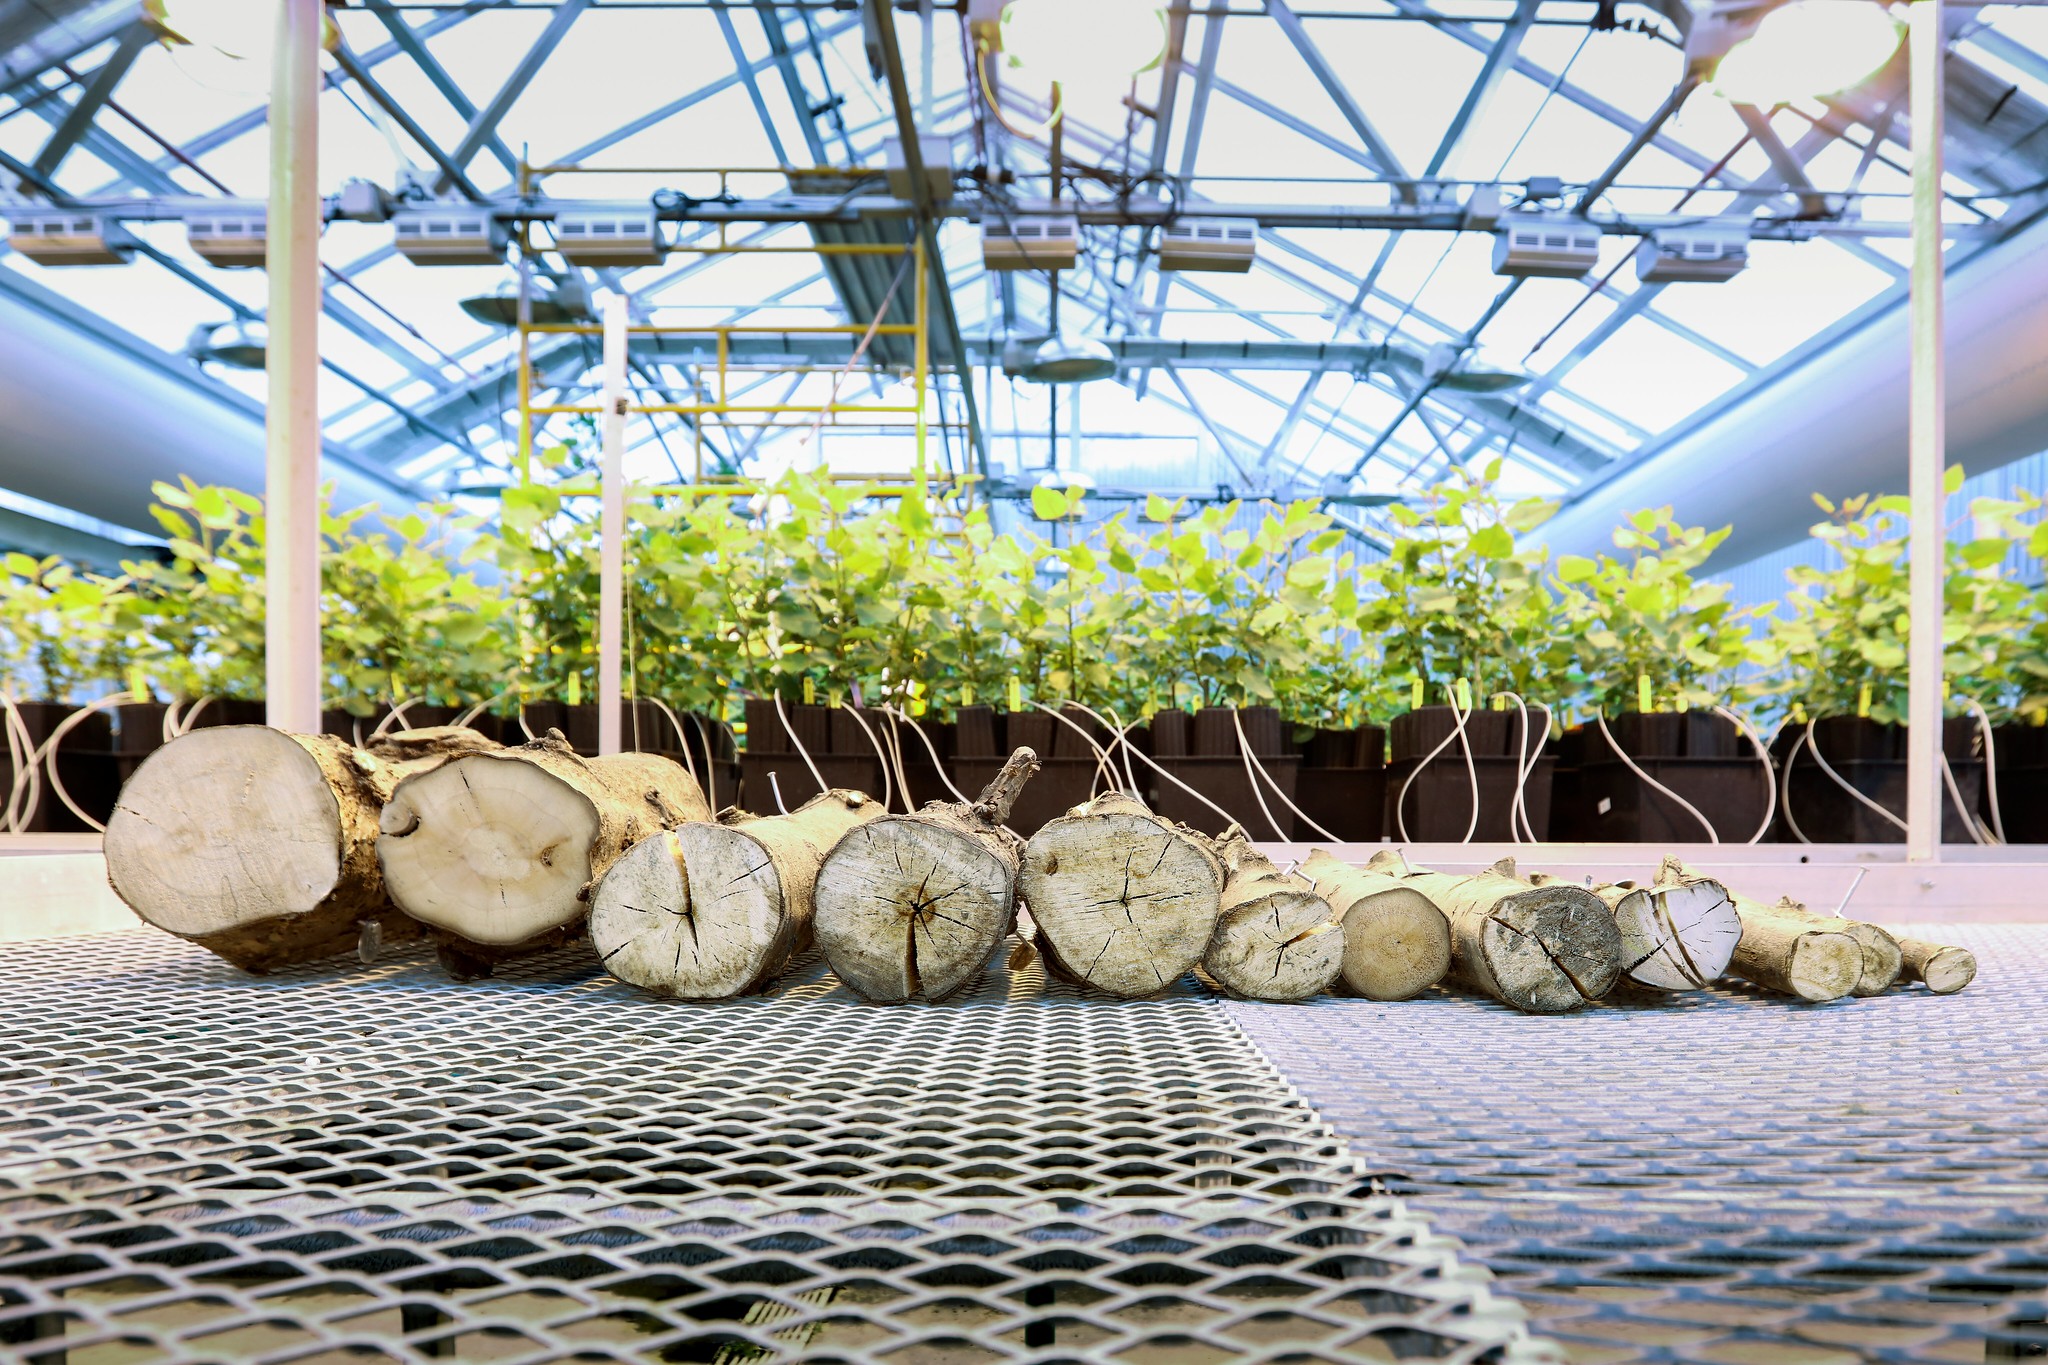
Figure 3.41: Researchers are investigating the genetic differences in these poplar trees harvested at the same time from the same field that result in greater yields of biomass for bioenergy. Credit: Jason Richards/ORNL, U.S. Dept. of Energy. Source: https://www.flickr.com/photos/oakridgelab/50340885838
https://www.flickr.com/photos/oakridgelab/50340885838
3.2.1 Background
This chapter discusses the use of biomass as a source of energy for heat, electricity generation and biofuels. The details and limitations regarding the growth and agriculture of various biomass sources will be discussed in a future chapter. Biomass has the primary advantage of renewability since crops can be grown year after year. This resource is only considered sustainable, however, when it can be harvested indefinitely meaning that the ecosystem capacity is not diminished, for example, by depleting the soil of nutrients.
In terms of emissions, biomass does emit carbon dioxide when combusted just like other carbon-containing fuels. However, scientists often use the term short-term or short-cycle carbon to describe biomass since photosynthesis and respiration happen over relatively short-time scales (years) compared to the very long creation times for fossil fuels (millions of years). Because of these vastly different time scales, carbon emissions are often accounted for differently than fossil fuels since these biomass emissions are reabsorbed by growing biomass in the next season. This question of carbon accounting will be discussed in the chapter.
Biomass has many more variations and types of applications than the other energy sources discussed so far. The process of photosynthesis takes solar energy and inorganic carbon (CO2) and converts it to organic-carbon compounds (carbohydrates). Biomass includes all of the different types of plant organic material as well as animals. In the context of renewable energy, biomass is defined as organic material that has properties advantageous for fuels. We will discuss biomass used directly for heat and electricity generation and biomass processed into biofuels for transportation systems. Technically, animals are also used as direct fuels in the form of calories for humans and other animals, but this is different than its use to produce heat, electricity or biofuels. These concepts will be discussed in the chapter on food and agriculture.
Learning Objectives
At the end of this chapter, students should be able to:
-
Estimate the energy available in biomass from energy density and yield
-
Apply processing efficiencies to estimate biofuel energy amounts
-
Explain current limitations to biomass and biofuel processing
-
Explain the differences between the most common biomass processes and the resulting biofuels
-
Define and explain Energy Return on Investment (EROI) for biofuels
-
Explain the main Triple Bottom Line Impacts (Emissions, Economics, Environmental Justice) For Biomass and Biofuels
-
Explain the debate on carbon emission accounting for biomass compared to fossil fuels
3.2.1.1 Biomass and Biofuel Resources
Department of Energy – Biomass Basics - an overview of biomass use for energy.
National Renewable Energy Laboratory – Bioenergy - the US national laboratory site focused on various bioenergy research and development areas
[National Renewable Energy Laboratory – Biomass Resource Data, Tools, and Maps] (https://www.nrel.gov/gis/biomass.html) - this site allows exploration of biomass resource data via online geospatial tools, downloadable U.S. maps and data sets.
3.2.2 Biomass Energy Resource Distribution
Biomass is a general term that refers to organic materials used directly for fuels or converted to another energy product. These energy resources are commonly referred to as “feedstocks.”
Biomass feedstocks include crops grown specifically for energy use, residues or waste products from non-energy agricultural crops, residues from forestry or processed wood products, algae, organic municipal and industrial wastes, animal wastes, and food waste. Given this wide range of biomass sources and the variation in their amounts from year to year, it’s difficult to get an accurate estimate of the amount of potential biomass resources available.
The Energy Information Administration (EIA) states that [bioenergy] (https://www.iea.org/energy-system/renewables/bioenergy) is the largest source of renewable energy globally, accounting for 55% of renewable energy and over 6% of global energy supply. This estimate is close to the primary energy consumption value that we have seen previously in figure 3.42 where 60% of the US renewable energy is from biomass and fuels.
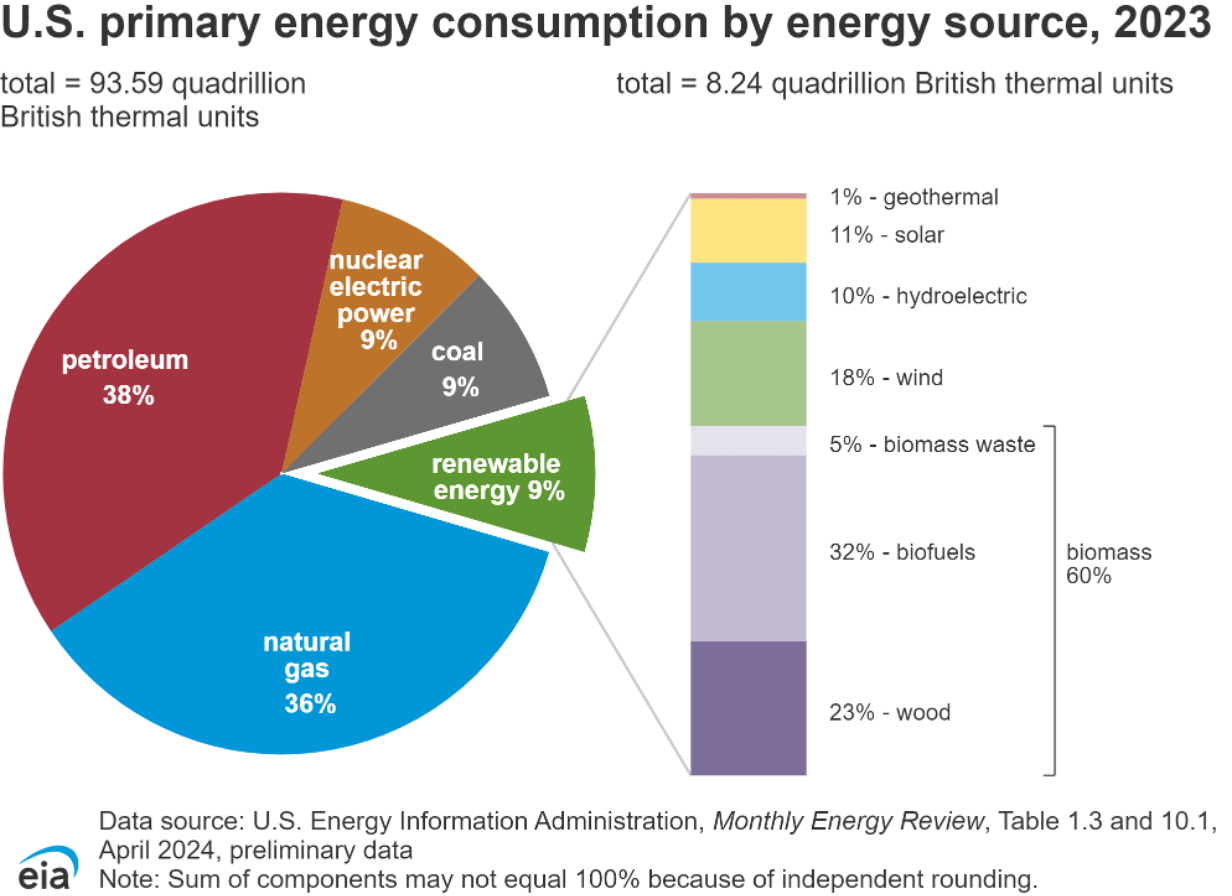
Figure 3.42: U.S. primary energy consumption by energy source, 2023. Source: EIA
The National Renewable Energy Lab (NREL) has detailed geospatial maps of US biomass resources in the following categories: Total Solid US Biomass Resources Solid US Biomass Resources per Square Kilometer US Biomass Crop Residues US Urban Wood Waste US Forest Residues US Primary Mill Residues US Secondary Mill Residues US Estimated Methane Generation Potential US Landfill Methane Emissions US Animal Manure Methane Generation Potential US Organic Waste Methane Generation Potential US Wastewater Methane Generation Potential
We will focus only on one of these biomass sources as an example. Trees and forest-residue are a significant source of available biomass that can be used directly as a fuel for heat or electricity generation. Figure 3.43 highlights the distribution of available forest-residues after logging operations in the US. Using forest residue as an energy source makes more efficient use of the total biomass in the system. The Department of Energy (DOE) estimates quantities of forest residue biomass potential vary from about 33 - 119 million dry tons currently to about 35 - 129 million dry tons in 2030 at a price range of $20 to $80 per dry ton.
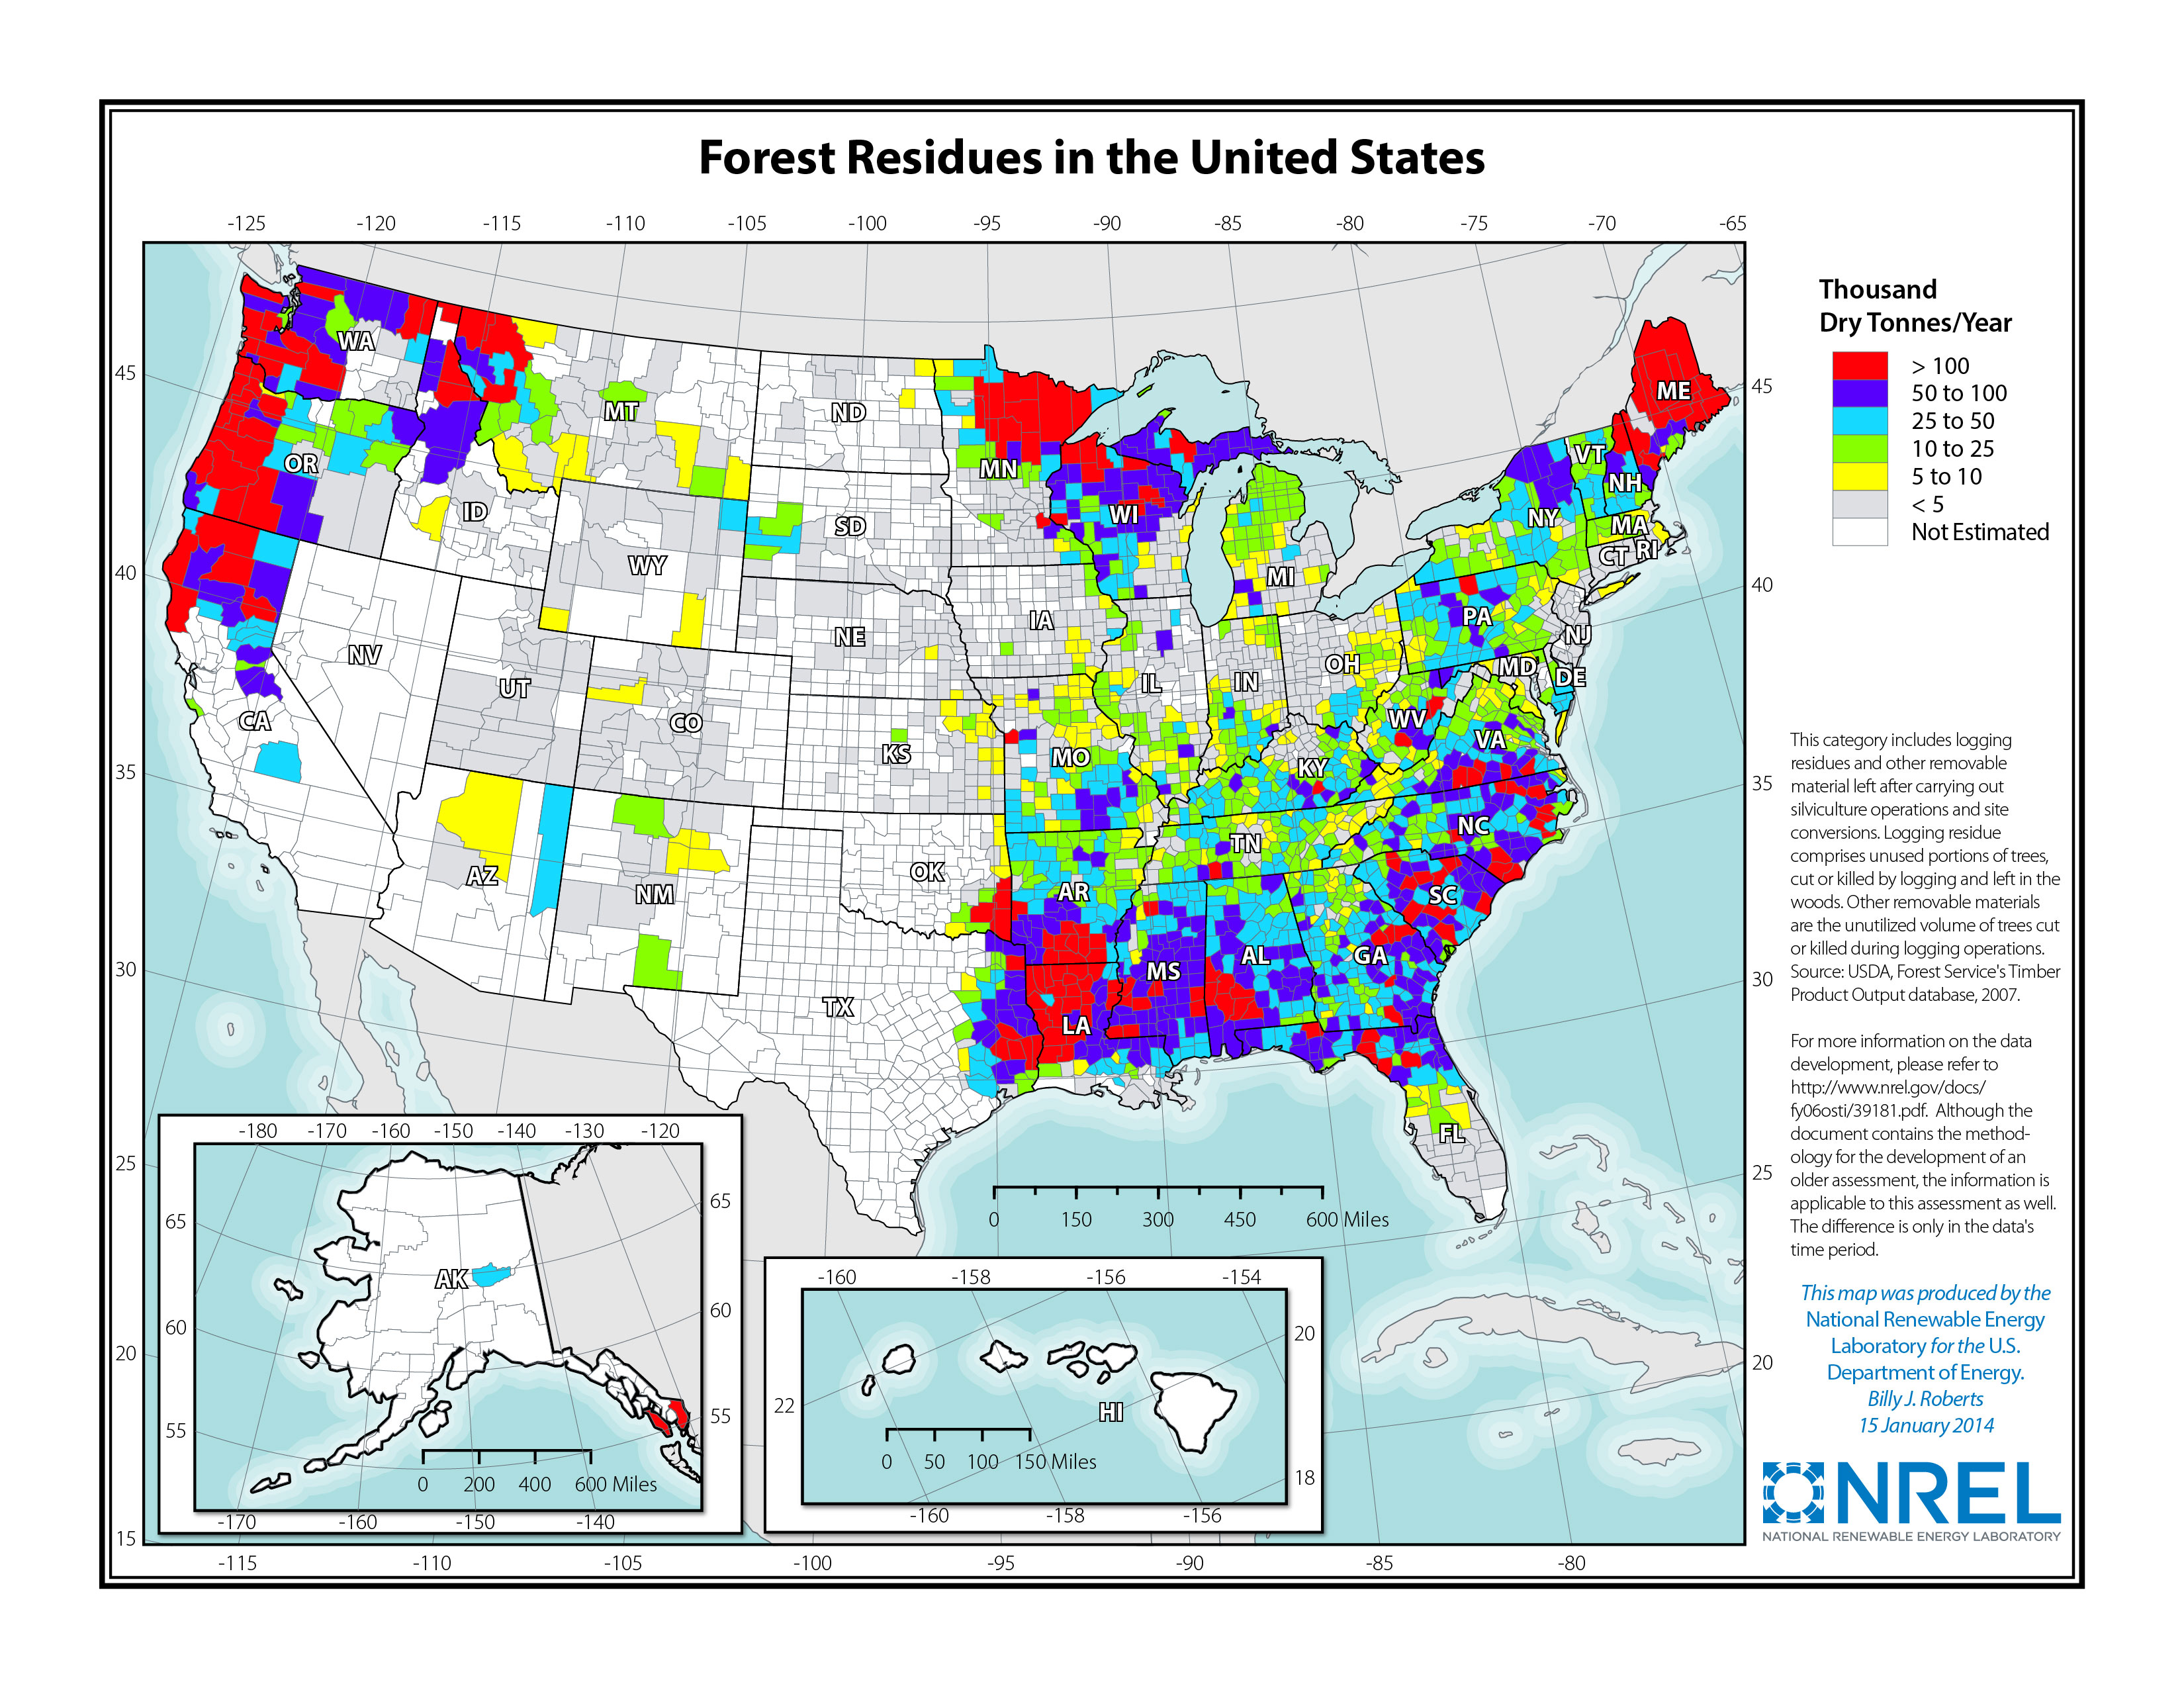
Figure 3.43: Forest residue across the United States. Forest residue includes material left after logging operations. Source: NREL, https://www.nrel.gov/gis/biomass.html
Plantation forests are found across the globe. Within Virginia, there is a $16 billion forestry sector compromised mostly of small operations throughout the Commonwealth, but there are some larger silvaculture (the agriculture of trees) operations in the Piedmont region. Forestry provides us with wood and timber we use for our houses and furniture, and using the residues from this industry provides an opportunity to capture that short term carbon storage and turn it into electricity or heat. This image (Figure 3.44 highlights a Canadian Forest, from which a large amount of US wood products are derived. In recent years, Canadian forests have been under threat due to rising global temperatures which affect both the growth season and pests like the mountain pine beetle whose population have grown and severely damaged trees thousands of acres of forest as summers have become warmer and drier along with milder winters that don’t kill these insects.

Figure 3.44: A Canadian forest where trees are regularly harvested and replanted to supply wood products. Source: www.grida.no/resources/3121
To learn more about sustainable forestry, Virginia Cooperative Extension provides landowners across the state with valuable programs on sustainable harvesting, safety, and utilization of these resources.
3.2.3 Biomass Energy
So how much energy is in wood? This depends directly on how much water is in the wood. Have you ever gone camping and found some fallen tree branches to use as firewood, only to experience intense smoke or hissing noises as you tried to get the campfire going? The branches you added to the fire were full of water, or moisture, which must be removed for an effective and hot fire. This is why people have a woodbox or woodpile to ‘season’ the wood over a summer or year so that it slowly loses moisture and dries out. The table below provides the energy density, also called heating Value, for a range of woods from high to low moisture content. Wood with high moisture content is often referred to as “green” wood. The energy content of wood also varies by species type, from hardwoods that are denser with a higher heat content (e.g., birch, oak, maple) to soft woods (e.g., douglass fir, cedar).
Table. Heating Values for Types of Woody Biomass source: Food and Agriculture Organization of the United Nations. 2002. Economic analysis of wood energy systems. Rome, Italy.
| Fuel Type | Moisture Content | Heating Value (MJ kg-1) |
|---|---|---|
| Green Wood | 50% | 9.5 |
| Seasoned Wood | 20% | 15.5 |
| Dry Sawdust | 13% | 16.2 |
| Wood Pellets | 10% | 16.8 |
| Dry Bark | 0% | 19.6 |
| Dry Branches | 0% | 20.1 |
| Dry Needles | 0% | 20.4 |
As seen above, moisture content is a key variable along with the wood type that controls the net available energy content (or heating value) of the wood. The equation relating moisture content (mc) to the weight (mass) of the wood is given by equation (3.20).
\[\begin{equation} mc = \frac{W_{g}-W_{0}}{W_{0}} \times 100% \tag{3.20} \end{equation}\]
where Wg = green wood weight and W0 = oven dry weight of wood. Oven dry wood has no moisture remaining in it.
At the homeowner scale, most people are also familiar with fireplaces in which wood is burnt directly for heat. In the days before central heating systems, cast iron wood stoves or fireplaces were the main form of house heating. Both stoves and fireplaces have heavy metal or stones that can contain the heat safely, direct smoke and emissions out of the house, and draw in more air for combustion. They also have a larger heat capacity to hold the heat and radiate it to the house over time. Unfortunately, this system also is very inefficient, losing 75 – 85% of the heat through the chimney for an efficiency of 15 – 25%.
Wood stoves and fireplaces can be made more efficient and connected to ventilation systems to push heated air around a house rather than heating a single room. This can increase the efficiency of the heating system to 75 – 90%. A wood stove or boiler can also be outdoors with heated air or water connected to the house at these higher efficiencies and often using automated wood pellets for fuel rather than hand-loaded wood logs.
3.2.4 Biomass for Electricity Production
As the scale of energy increases, direct heating with wood is more difficult. Large scale use of wood for energy can be done like fossil fuels in a steam power plant to generate electricity. Power plants that use wood residue to generate electricity generally use wood chips since the logistics of transporting, storing, and supplying it to the power plant for combustion are much simpler. The forest residue is collected on site, allowed to dry, and then chipped to further dry before transport. As mentioned, wood residue is often considered a waste material and therefore can provide a low-cost fuel in some locations. Wood chips are transported, stored, and fed into a combustion unit, where the generated heat produces steam which drives the attached turbine. Using the state of Virginia as an example, in 2023 there was approximately 250 MW of rated power across 5 wood-fired facilities (see table below). The first 3 power plants in the table were coal-fired power plants that were converted to wood in 2013.
Table. Virginia Biomass Plants
| Plant Name | Sector | Total Capacity (MW) |
|---|---|---|
| Hopewell Power Station | Electric Utility | 51 |
| Altavista Power Station | Electric Utility | 51 |
| Southampton Power Station | Electric Utility | 51 |
| Hopewell Mill | Industrial CHP | 47.6 |
| Multitrade of Pittsylvania LP | Electric Utility | 83 |
| Halifax County Biomass | IPP Non-CHP | 49.9 |
For Biomass Electrical Plants, we can draw a modified energy system diagram (figure 3.45) which is similar to those discussed previously for fossil fuel power plants. For biomass fuel, we are interested in the land area (A) from which the biomass is grown or harvested and the yield (Y), which is the amount harvested from that area in a given year. Yield is given in mass or volume of biomass per area such as tons/acre or cubic feet/m2. We can calculate the input energy, Ebiomass, using the energy density of the biomass and the energy amount in Equation (3.21) just like was done for the fossil fuels. Alternatively, given an input energy requirement, we can back calculate the amount of biomass or land needed.
\[\begin{equation} E_{biomass} = A \times Y \times \rho_{biomass} \tag{3.21} \end{equation}\]
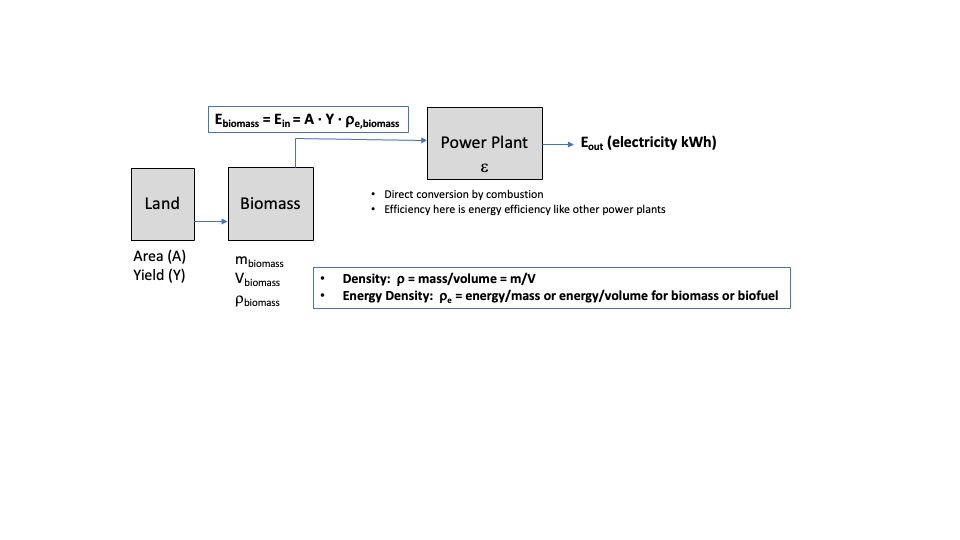
Figure 3.45: Diagram for a biomass electrical plant.
Exercise 1:
How much wood chips (tons/yr) and forest area (acres/yr) are needed to generate enough electricity if the VT steam power plant used wood instead of natural gas? Assume that the campus uses 25,000 MWh/yr electricity from the on-campus plant and ignore transmission losses. Assume that the energy density of dry wood chips is 18.0 MJ/kg, the power plant efficiency is 32%, and the yield of wood chips from trees grown specifically for energy use is 90 tons/acre.
Eps = Eout/Ein –> Ein = Eout/eps = 25,000 MWh/yr / 0.32 = 78,125 MWh/yr
Rhowood = Ewood/mwood –> mwood = Ewood/rhowood = (78,125 MWh/yr/18 MJ/kg)(1000 kWh/MWh)(3.6 MJ/kWh)(1 ton/907 kg) = 17,227 tons/yr
Mwood = Awood/Ywood –> Awood = Mwood/Ywood = 17,227 tons/yr / 90 tons/acre = 191 acres
Note that this exercise uses a number of simplifying assumptions. Most forest land is not turned entirely into wood chips, but rather some boards are cut and the rest is chipped. This problem also simplifies the moisture content which determines both the energy density and mass yield. Look up conversions from acres to square feet, square meters, football fields, or drillfield area to get a sense for the size of this forested area.
Biofuels
Biofuels are intended to replace fossil fuel-based liquid fuels with similar combustion properties. Primarily, this means the replacement of gasoline and diesel derived from petroleum with combustible liquids made from biomass. There are many different biomass sources and processing methods to convert biological feedstocks to biofuels. We already discussed the direct combustion of biomass for energy by heating or in steam power plants. Biofuels are different in that they are processed to produce fuels which can replace current liquid fuels without major performance, equipment, or infrastructure issues. In most cases, liquid biofuels are a direct replacement for their fossil-fuel counterparts. Figure (ref?)(fig:knitr-figureBIO1) shows the process pathways in a general biorefinery to biopower, biofuels, and bioproducts. Figure (ref?)(fig:knitr-figureBIO2) from Allen et al. (2018) clearly includes the integration of biology as part of the cycle, and the opportunity for industrial symbiosis – here taking nutrient rich water from wastewater and co-locating with algal bioreactors.
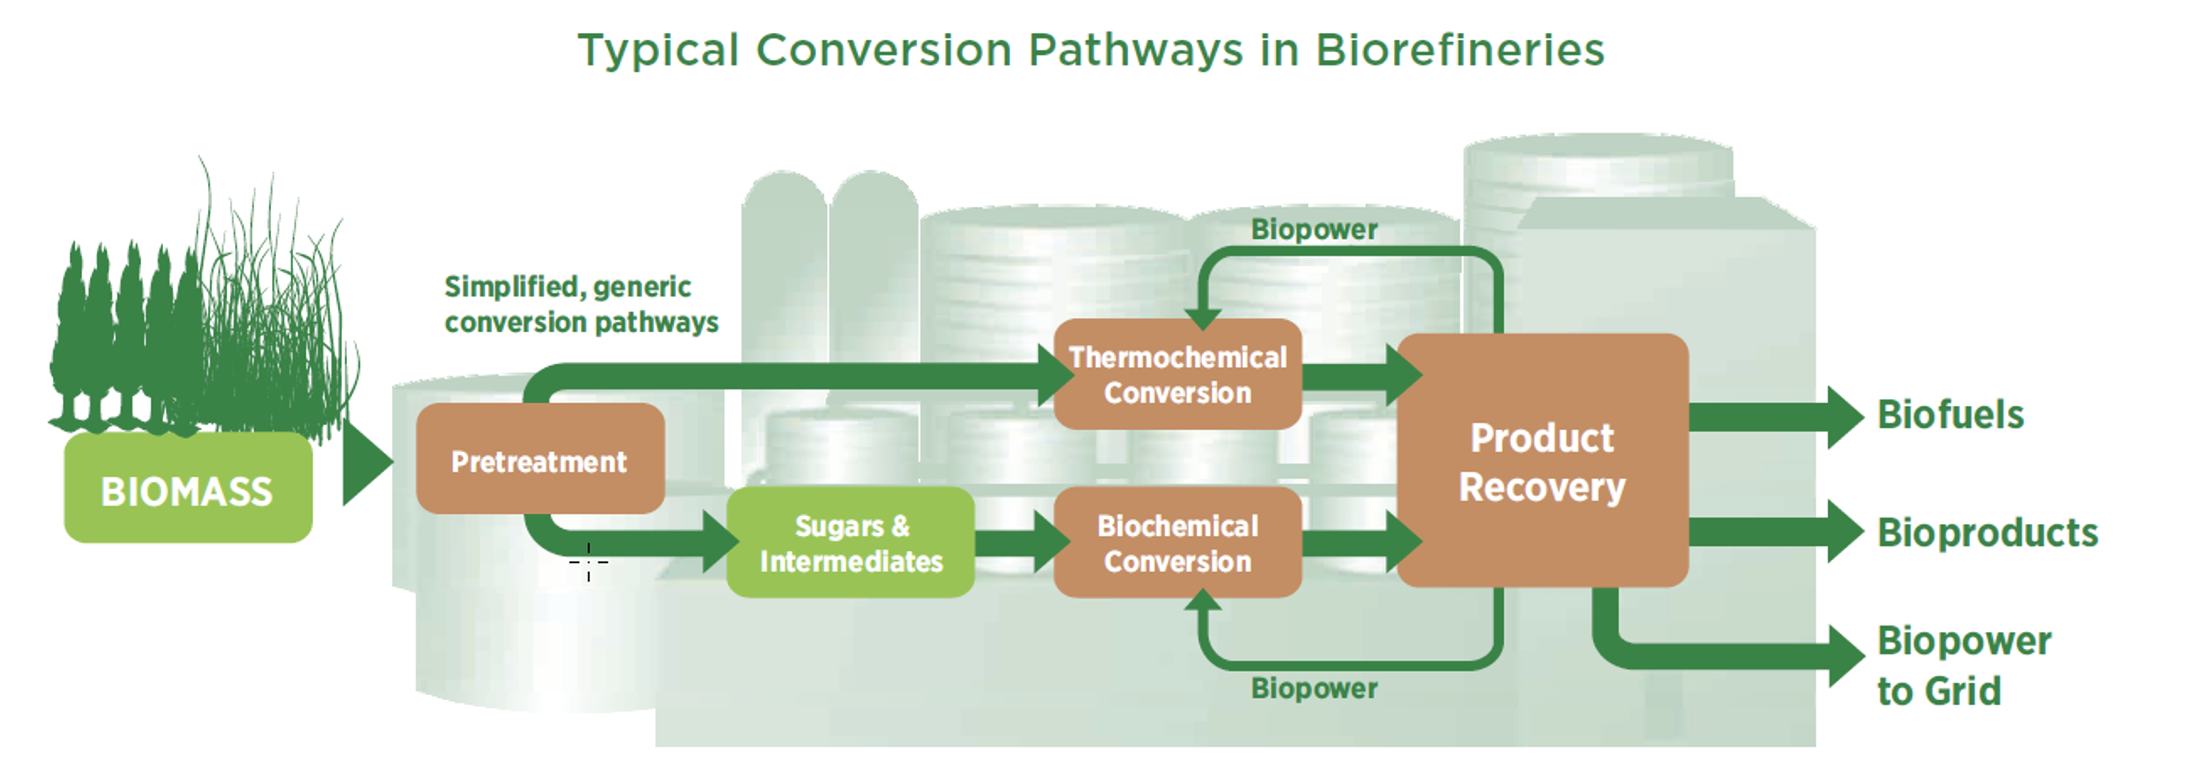
Figure 3.46: Traditional biomass conversion pathways into biofuels. Source: DOE EERE, Inegrated Biorefineries, 2014.
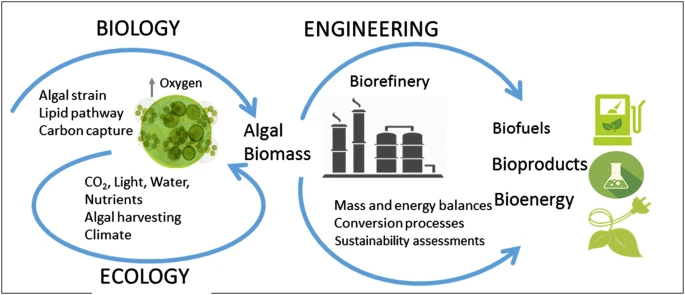
Figure 3.47: Integrating Biology and Ecology into the engineering behind biofuels is critical to considering the sustainability of biofuels and identifying synergistic opportunities. Source: Allen et. al., 2018, https://doi.org/10.1186/s40643-018-0233-5
Liquid fuels pack a lot of energy per mass or volume, in contrast to current battery technology which is discussed in the next chapter. Biofuels provide a replacement for non-renewable fuels without significant changes to the vehicle systems, for example. We’ll see that some biofuels, such as ethanol, have low EROI values (energy out vs. energy required to produce fuel over the life cycle). This older video highlights some of the basic biochemical processes for turning biomass into biofuels. For the record, it leaves out the growing, harvesting, and transporting of biomass to the refinery (if you want to learn more about research centers focused on bioenergy, navigate here. When you watch the video, think about the following questions:
-
What can breakdown biomaterial into sugars?
-
What is the process the microbes use to convert sugars into alcohol?
-
What is the name of the 2 processes that use high heat to convert biomass into oil or biogas?
-
High-heat requires energy itself. What does this mean for the EROI?
-
Biofuels require land to grow the crop for use as a biomaterial. What are the other uses of this land, and who/what may be impacted?
-
The video shows algae grown in a reactors or what look like large pools. Specific algae can indeed yield high amounts of oil. What are the logistical challenges and other resources needed for these?
Ethanol, biodiesel, and methane are the primary biofuels made by these processes, but there are some others including hydrogen and syngas. Green hydrogen, that is hydrogen that is created using renewable energy, has the potential to transform the heavy transportation sector into a zero-carbon emissions. Green hydrogen is one of DOE’s EarthShots - the goal is to create 1 kg of H2 for /$1 in 10 years.
Figure 3.48 shows a number of the pathways from biomass sources to biofuels using different conversion processes. 1st generation biomass are oils, starches, and sugars which are more easily converted to liquid fuels. The most common examples of this are the use of soybean oil to make biodiesel and corn or sugarcane to make bioethanol. 2nd and 3rd generation biomass are more difficult to convert since they are composed of the woody parts of plants – cellulose and hemicellulose which are bound strongly together with lignin.
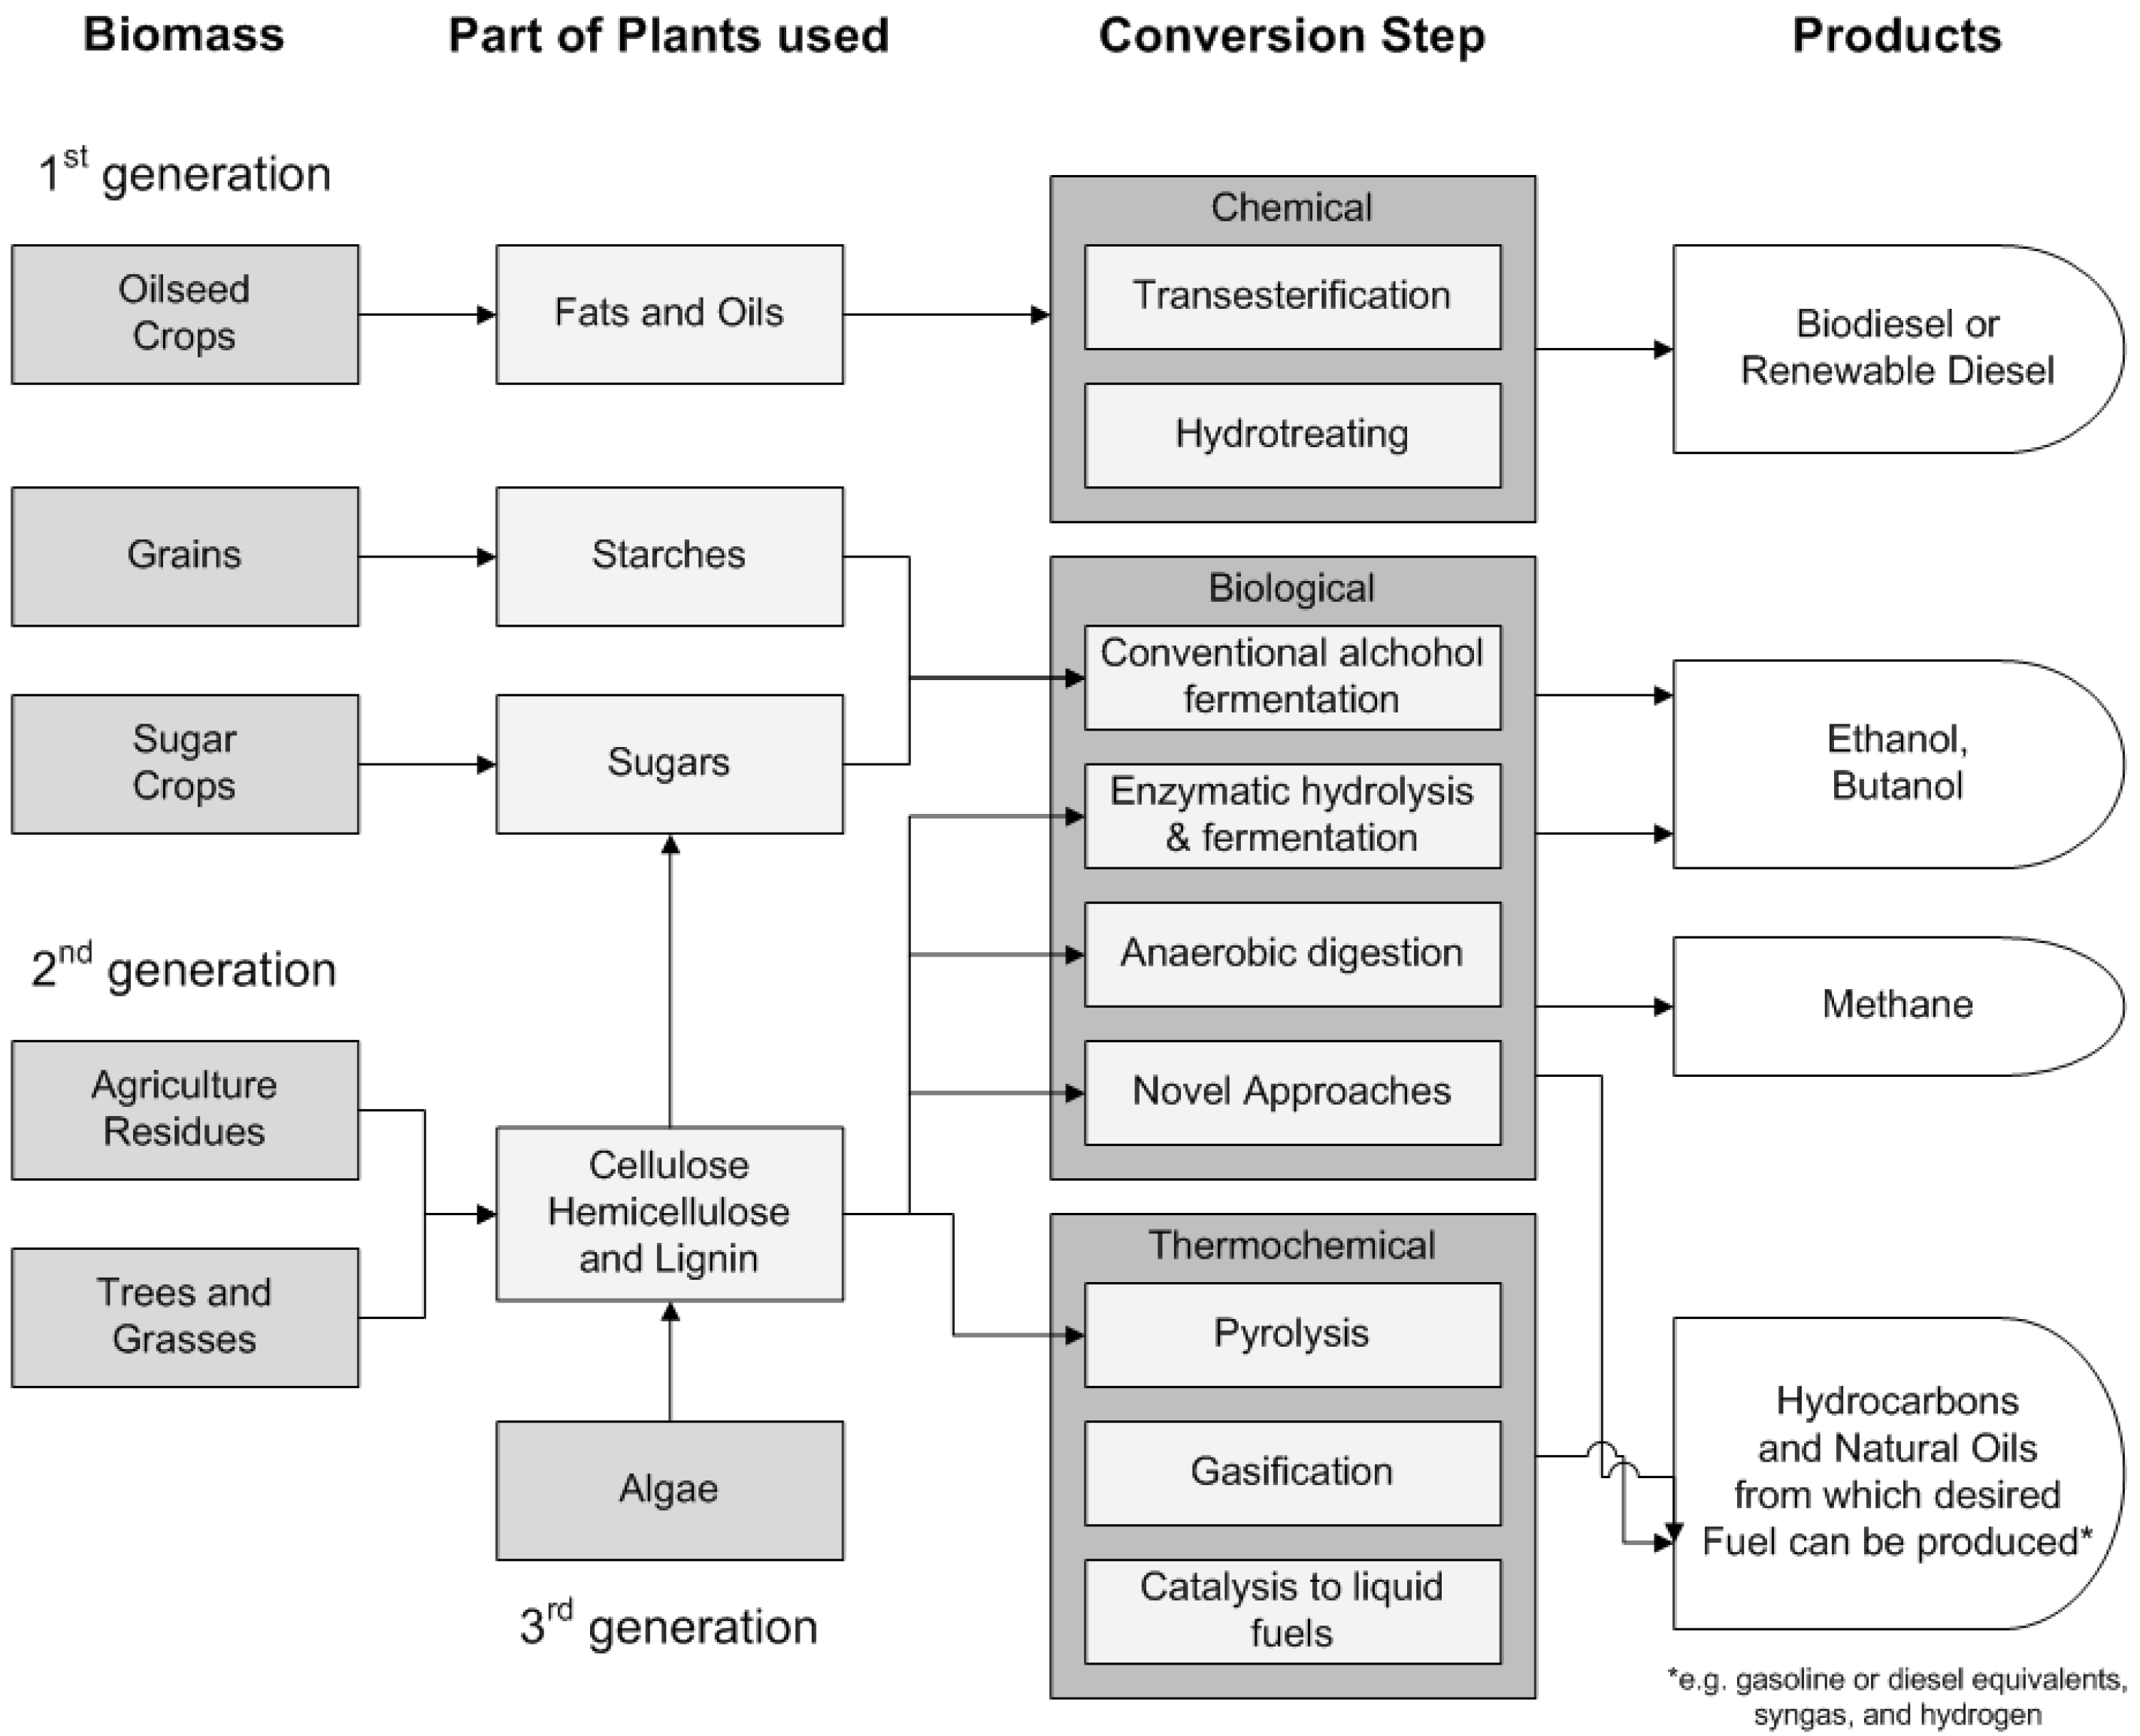
Figure 3.48: Specific pathways for concerting biomass into biofuels. Source: Allen et. al., 2018, https://doi.org/10.3390/su5073129
Depending on the biomass source and chemical structure, different conversion processes are more efficient and appropriate. It is important to note that all biomass can be converted into all types of biofuel – specific pathways are critical for efficiency and economics.
For example, oils can be converted to biodiesel through a chemical reaction called transesterification. Starches and sugars, in contrast, are fermented into bioethanol under specific conditions but these same chemicals decompose by anaerobic digestion via bacteria when they are in an environment without oxygen – like waste food buried in a landfill.
Cellulosic biomass processes generally consist of additional steps like acid treatments and enzymes to break down these woody components into starches and sugars which are easier to convert. This type of biomass can also be broken down by heat using pyrolysis or gasification processes which are more complex and often result in mixtures of gases known as syngas which contains varying amounts of carbon dioxide, carbon dioxide, hydrogen, and other chemicals depending on the biomass source and specific processing conditions. Research around the world based on locally available biomass sources is underway using many variations of these processes to look for efficient, safe, and inexpensive ways to produce biofuels.
Estimating the energy for biomass will change from crop to crop, but all calculations of this kind are handled in a similar way with an equation like the following 2 equations (3.22) and (3.23). These equations should be considered an example which can be used with some modifications rather than formulas that you can just plug numbers into for all cases.
\[\begin{equation} E_{biomass} = A \times Y \times \rho_{biomass} \tag{3.22} \end{equation}\]
\[\begin{equation} E_{biofuel} = A \times Y \times \eps_{1} \times \eps_{2} \times \eps_{n} \times \rho_{e,biofuel} \tag{3.23} \end{equation}\]
This is shown schematically by the following figure 3.49.
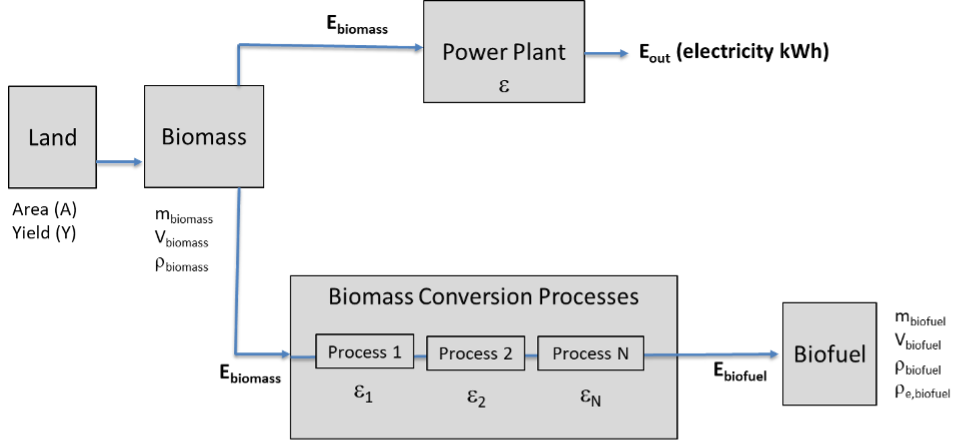
Figure 3.49: Diagram depicting biomass production to either direct use within a power plant or conversion to biofuel.
Ebiomass is energy content of the biomass which is the input energy, Ein, for the system like a power plant or vehicle engine. The biomass energy density, biomass, is used in this case and is moisture dependent. Moist crops, like fresh cut trees, will have much lower energy density than dry crops since the water carries mass but not energy. When biomass is used directly for combustion in a power plant, the efficiency of the plant is used to determine Eout = Ein.
Area, A, is the land area on which the crop is grown. Note that crop yield, Y, is often sensitive to the specific land used and typically given in mass/area or volume/area. If yield is given in mass units, you need the mass energy density, while for volume units, you will use volumetric energy density. Examples are kilograms/hectare (kg/ha) or bushels/acre. Conversions from mass yield to volumetric yield can be done using the crop density (mass/volume)
For biofuels, the energy density depends on the energy density of the fuel produced, re, biofuel. in energy/mass or energy/volume. Examples are MJ/kg or BTU/liter. Biofuel energy will be different than biomass energy since the processing efficiencies to convert biomass into biofuel results in the loss of mass and therefore energy.
Efficiencies, 1, 2, n, are the process efficiencies of the biomass conversion process to biofuel, Ebiofuel which is energy in the output liquid fuel. There are often several different efficiencies to consider such as the fraction of the crop that is harvested, the fraction of the crop that is used (only the oil is used from soybeans to make biodiesel), and the chemical conversion efficiency (not all of the soybean oil is converted to biodiesel). These can be energy-, mass-, or volume-based efficiencies, but they are always defined as the outputs divided by inputs.Exercise 2:
Biodiesel is a renewable form of petroleum created by growing and harvesting algae. Let’s look at an example calculation to work through what we’d need to replace regular diesel. The primary question is the following:
How much area (m2) is needed for the algae ponds to generate 1 million gallons of biodiesel per year?
Given information:
-
Algae grown in this case has a yield of 6 kg m-2 per year.
-
The triglyceride (oil) content of this algae is 20% by mass and the oil-to-biodiesel conversion process is 92% mass efficient.
-
The resulting biodiesel a density of 3.3 kg/gallon
Potential Equations
Ebiomass = A x Y x pebiofuel
(if Y is given in mass units, you need the mass energy density) (if Y is given in volume units, you need the volumetric energy density)
Ebiofuel = A x Y x e1 x e2 x en x pebiofuel
Solution
Here, we know that that V = 1 x 10⁶ gallons year-1.
From the energy density equation, we know:
pebiofuel = mass/volume
We can rearrange the equation to solve for mass of the biofuel.
Massbiofuel = pebiofuel x volume = (3.3 kg/gallon) x (1 x 10⁶ gallons year-1) = 3.3 x 10⁶ gallons year-1
Now that you know the mass of the biofuel, we also have the mass efficiencies for converting the algae to the biofuel. Thus, we can calculate the mass of algae:
Massbiofuel = Massalgae x e1 x e2
Massalgae = Massbiofuel / e1 / e2
Massalgae = 3.3 x 10⁶ gallons year-1 / 0.92 / 0.2
Massalgae = 17.9 x 10⁶ gallons year-1
Now that we have the mass of the algae, let’s look at the yield given. In this problem, the yield is given in units of mass per area per time. Since we the mass and want to calculate area, we can use the following equation based on the definition of yield:
Y = Mass / Area
Area = Mass / Y = 17.9 x 10⁶ gallons year-1 / 6 kg m-2 year-1
Area = 3 x 10⁶ m2 yr-1
Exercise 3:
Assume Virginia Tech has approximately 100 acres of land (approximately 10 times the size of the drillfield) for a pilot project on biomass. Corn will be grown on this land for the production of ethanol. Corn grain has an energy density of 8.0 MJ/lb. Ethanol has a volumetric density of 6.8 lb/gallon and an energy density of 95 MJ/gallon.
The average yield of corn grain in a season is approximately 150 bushels/acre for Virginia farmland. A bushel is a unit of volume and an acre is a unit of area. The density of corn grain is 56 lbs/bushel. The conversion of corn grains from starch to sugar to ethanol has an overall efficiency of 30% by mass.
For every 1.0 lb of corn grain produced, 1.1 lb of corn stover (the corn stalks and leaves) are available for cellulosic ethanol production. The conversion of cellulosic corn stover to ethanol has an overall efficiency of 24% by mass. Corn stover has an energy density of 7.0 MJ/lb.
-
How much ethanol (gallons) can be produced from the corn grain grown in a single season on this VT land?
-
What is the energy efficiency (%) of the process to convert corn grain into ethanol gallons?
-
How much ethanol (gallons) can be produced from the corn stover left over from a single season on this VT land?
-
How much electricity (kWh) could be produced in a single season with the corn stover from this land if it were combusted directly in a power plant with 35% efficiency rather than converted to ethanol?
3.2.5 Triple Bottom Line for Biomass and Biofuels
Like the other renewable energy sources, there are many TBL issues for biomass and biofuels that we can only briefly cover here. The agriculture and processing of biomass and biofuels produces jobs and economics benefits for the agricultural sector instead of the mining sector. This benefits people in some parts of the US and world and can take away jobs and money from others since these resources replace fossil fuels to some degree.
Water is a limited resource and a major input to many, but not all biomass resources. This will be discussed in more detail in the Water and Agriculture Units, but can be a problem for water-intensive crops or crops grown in areas without low water resources. This is one reason that some biomass crops are preferred over others, for example, switchgrass and other woody plants typically needs much less water than crops like corn or sugarcane. These two examples also need less fertilizer and pesticides compared to other crops which is a significant environmental benefit.
The economics of biomass and biofuels is a complex issue since some crops like corn or soybeans are often subsidized for energy production, meaning the government pays an additional prices for these crops where they are directed to energy applications. While this can be very beneficial to farmers, it can have economic impacts like raising the prices of some food crops. This is a reason that some people argue against using food crops for energy and suggest a focus on non-food crops to avoid this competition of food vs. Fuel. Cellulosic ethanol, which uses the non-food parts of plants avoid this issue, but the trade-off is the added difficulty of processing cellulosic materials compared to the simpler sugars and starches. High or subsidized prices for energy crops can also lead to additional deforestation or land conversion which also have environmental impacts.
The carbon dioxide emissions are another complex issue which scientists continue to debate. The combustion of biomass or biofuels necessarily emits carbon dioxide into the atmosphere where it acts as a greenhouse gas. Yet, carbon accounting rules often don’t count these carbon emissions based on the argument that when the biomass is grown again in the next season, the carbon will be sequestered from the atmosphere by the plants as they grow. This is technically true, but assumes a number of things including that the same amount of biomass is grown as was harvested in the previous year. It should be noted that carbon accounting for biomass systems does account for the electricity and fuels to harvest, process, and transport biomass and biofuels which adds carbon dioxide emissions and makes biomass low-carbon instead of carbon-neutral even if combustion emissions are not counted.
Considering the capture of methane from food waste in landfills or organic wastes from wastewater treatment plants has signficant environmental benefits given the higher global warming potential of methane. Add methane capture to both food and water waste systems is becoming a best practice and is technically relatively simple since the conversion process is done automatically by anaerobic digestion by bacteria.
The Energy Return on Investment (EROI) for biofuels and biomass is often low since the processing of these materials is not as advanced or efficient as the fossil fuels.
3.2.6 Definitions
Anaerobic Digestion – the conversion of organic materials by bacteria into methane in the absence of oxygen
Biochar – a solid material like charcoal with high carbon content that is obtained in the thermochemical conversion of biomass in an oxygen-limited environment
Biomass – organic material that can be used directly for energy or converted to other chemicals for energy sources
Biofuel – fuel sources that have been produced from biomass by a variety of natural or industrial processes
Cellulosic Ethanol – ethanol produced from the cellulose, or woody component, of plants
Fermentation – the natural decomposition of synthetic conversion of sugars to alcohol by bacteria, yeasts, or other microorganisms
Gasification – a high temperature process (>700 C) that converts biomass without combustion into a gas mixture called syngas.
Moisture content – the fraction of total mass that is water generally reported as a percentage
Pyrolysis - the high temperature heating (>500 C) of biomass in the absence of oxygen which thermally decomposes the chemicals into liquid bio-oil, solid bio-char, and syngas.
Syngas – a gas mixture including nitrogen (N2), carbon monoxide (CO), hydrogen (H2), and carbon dioxide (CO2), and other hydrocarbons which results from a number of high temperature biomass processes.
Transesterification - a chemical process that converts biomass into biodiesel through a reaction between alcohol, free fatty acids (oils), and a catalyst
Yield – the amount of biomass obtained from an area of production (land, forest, pond, etc) given in units of mass/area or volume/area
3.3 Energy Storage

(#fig:knitr-EnergyStorage_1)Research is ongoing to improve battery technology. This scanning electron microscope image is of porous nanoparticles, which can serve as cathodes in a battery. Source: Pacific Northwest National Laboratory - https://www.flickr.com/photos/pnnl/25357781507/in/photolist-ECMfZr-ebEhsm-ciabm1-27bpdqy-JRMFPc-8D5B6w-P6PuGB-8zvQSy-fqLEkC-2naiFop-8D5Bq3-TJkhBe-2iZSD8t-9PWjXp-2chH5Kf
3.3.1 Background
This chapter is focused on the energy storage systems which are a key technology for the full-scale integration of renewable energy sources into the electrical grid. This need should be clear based on the explanation of the variability of solar, wind, and hydropower systems both daily and seasonally in the previous chapter.
This chapter discusses both the different categories of energy storage systems (chemical, mechanical, thermal, etc.) and specific types of energy storage (batteries, pumped hydropower, flywheels, etc). These systems differ in their scale, fundamental physics, and time scale for charging and discharging. All of these issues are important for matching energy storage systems to applications.
Learning Objectives
At the end of this chapter, students should be able to:
-
List the main categories of energy storage systems and the primary advantages and disadvantages of each.
-
Define the round-trip energy storage efficiency and apply it quanitatively to storage problems.
-
Estimate battery and storage sizes based on energy requirements
-
Explain the main Triple Bottom Line Impacts (Emissions, Economics, Environmental Justice) For Energy Storage Systems
3.3.1.1 Energy Storage System Resources
Department of Energy – Global Energy Storage Database - a searchable online database of more than 2,000 global energy storage systems and facilities
National Renewable Energy Laboratory – Energy Storage Research - the US national laboratory site focused on various energy storage research and development areas
[International Energy Administration (IEA)– Grid Scale Storage] (https://www.iea.org/energy-system/electricity/grid-scale-storage) - an overview of global grid-scale energy storage systems, programs, and research
3.3.2 Grid Storage Overview
This unit’s discussion of renewable energy systems has brought up a key issue and disadvantage of many renewable power systems - availability. Fossil fuel and biomass power systems depend on the delivery of large amounts of physical fuels which can be stored for some time. In contrast, solar, wind and some hydropower systems have daily and/or seasonal variability. Because of this variability, electricity supply and demand do not match as well for these renewable systems as for fossil fuel systems whose energy outputs can be controlled by the fuel rate. At the current low implementation levels of renewable energy in the US, stable and reliable baseline energy throughout the day and year can be provided by fossil fuel power plants. However, significant battery storage will be required for the grid if wind and solar are going to offset fossil fuels for electricity generation by any large extent in the future.
The US electric grid consisting of all the sub-grids discussed earlier must balance electricity supply and demand at all times. Excess electricity must be stored or lost and increased demand must be supplied continually or there is the risk of brownouts - local regions of power outages - or larger-scale grid failure. Effective energy storage, therefore, enhances grid reliability, facilitates effective utilization of intermittent renewable sources, reduces the need for increased peak generation capacity, and allows for a future with smart integrated energy system. The disadvantages of energy storage systems include energy losses, increased costs and complexity, and additional infrastructure and space requirements.
There are many different forms of energy storage beyond batteries which are the most well-known and used for small amounts of energy storage. Energy storage includes any system which can store energy for later use. Often, these systems convert energy from one form to another. For electricity systems, energy storage allows for predictability in the supply of electricity and, ideally, allows for fast access when additional electricity is required. Even for baseline electricity dominated by fossil fuel, energy storage is helpful to manage short periods of high electricity demand without the need to startup- and run natural gas power plants for short periods of time.
There are a wide variety of energy storage technologies as shown in Figure @ref(fig:knitr-energy_storage_main). Mechanical storage uses potential energy which is converted to kinetic energy and then electricity. This includes the pumped storage of water, the movement of mass from low to high elevation and back down, the spinning of a high mass flywheel, or the compression and expansion of gases. Electrochemical storage is primarily in the form of batteries that store and move electrons from one material to another via electrochemical reactions known as oxidation and reduction. Thermal storage takes advantage of the transfer of heat which has been stored in materials with high heat capacity or due to phase changes like ice to water. Electrical storage uses electricity to store energy in capacitors or superconducting magnets.
Hydrogen is given its own category in this figure but some people consider it as a fuel like methane. Many people categorize hydrogen as an energy storage medium rather than a fuel because molecular hydrogen is rarely available on earth to be mined like fossil fuels. Instead, it requires energy to be produced from other chemicals (for example, water or methane. Once produced, hydrogen can be stored indefinitely, transported (with some difficulties due to the small molecular size) and then used in fuel cells or for direct combustion.
(#fig:knitr-energy_storage_main)Energy Storage Systems are classified into 5 main categories. The figure highlights these with examples.
The details of the production of hydrogen from other chemicals make a big difference in its sustainability and environmental impacts. To differentiate between all these forms of hydrogen, the energy community has developed “color labels” to provide more information to consumers. These colors of hydrogen are show in figure @ref(fig:knitr- hydrogen_colors).

(#fig:knitr-hydrogen_colors)Hydrogen is produced using 5 primary approaches, categorized by color. Each process has an associated energy intensity (amount of energy required for production), cost, and associated carbon emissions.
Green hydrogen is produced from surplus electricity from solar and wind power to electrolyze, or split water, into its components of hydrogen and oxygen without emitting carbon dioxide. This form or hydrogen is considered the most environmentally-friendly. Blue hydrogen is produced by steam methane reforming (SMR) of natural gas (CH4) using water in the form of steam. This chemical reaction necessarily produces carbon dioxide, but the designation of blue hydrogen requires carbon capture and storage (CCS) so that carbon dioxide is not emitted to the atmosphere. If carbon dioxide produced by SMR is not captured, the product is considered grey hydrogen. Turquoise hydrogen is produced using a process called methane pyrolysis, which involves heating methane to high temperatures without oxygen like is done for some biomass processing. As was mentioned in the last chapter, this process produces hydrogen and solid carbon, biochar, which can be used as a valuable by-product to add carbon to the soil. Brown hydrogen is produced from coal through a process called coal gasification. This process involves heating coal with steam and oxygen to produce syngas which contains hydrogen, carbon monoxide, and carbon dioxide which is not captured. There are a few other “colors” of hydrogen generated by less common production methods.
Batteries are the most common form of energy storage and are familiar to everyone. These are electrochemical systems which work on concepts summarized in Figure 3.50. Batteries have an anode which, in chemical terms, is oxidized to release electrons. The cathode undergoes reduction and gains electrons. The electrons from these paired chemical reactions flow across an electrolyte to create an electrical current. Non-rechargeable batteries only have a limited amount of these chemical reactions which dictates the total amount of electrons that can be stored and released before the battery is “dead”, meaning that the voltage produced is not enough to power a given device. Rechargeable batteries, on the other hand, have reversible chemical reactions which allow the system to be electrochemically charged back up and used for hundreds to thousands of cycles before the voltage degrades to the point where they are not usable.
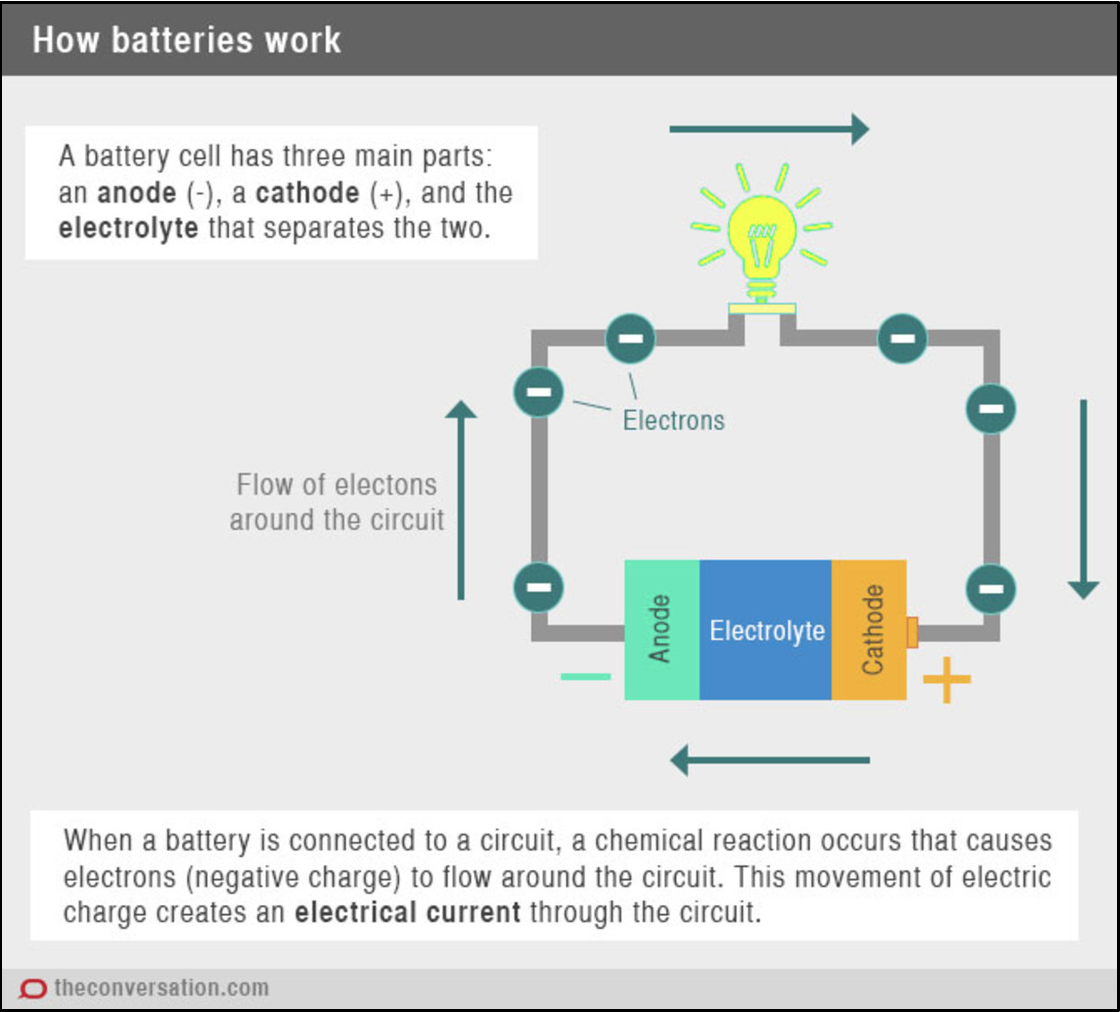
Figure 3.50: Battery System Schematic. SourceL: Renewable and Sustainable Energy Reviews 94, 2018, 804-821.
Several familiar battery types are shown in Figure 3.51. The table shows the typical chemistry for each type, though there are variations in the chemical details for each battery depending on the manufacturer and application. The “alphabet” cylindrical batteries – AAA, AA, C, and D - are now commonly available in rechargeable form. 9-volt rectangular batteries are less commonly available as rechargeable. Button batteries are often not rechargeable mainly due to their shape. Automobile batteries and the now ubiquitous lithium-ion batteries in most electronic devices are rechargeable with thousands of cycles of lifetime.
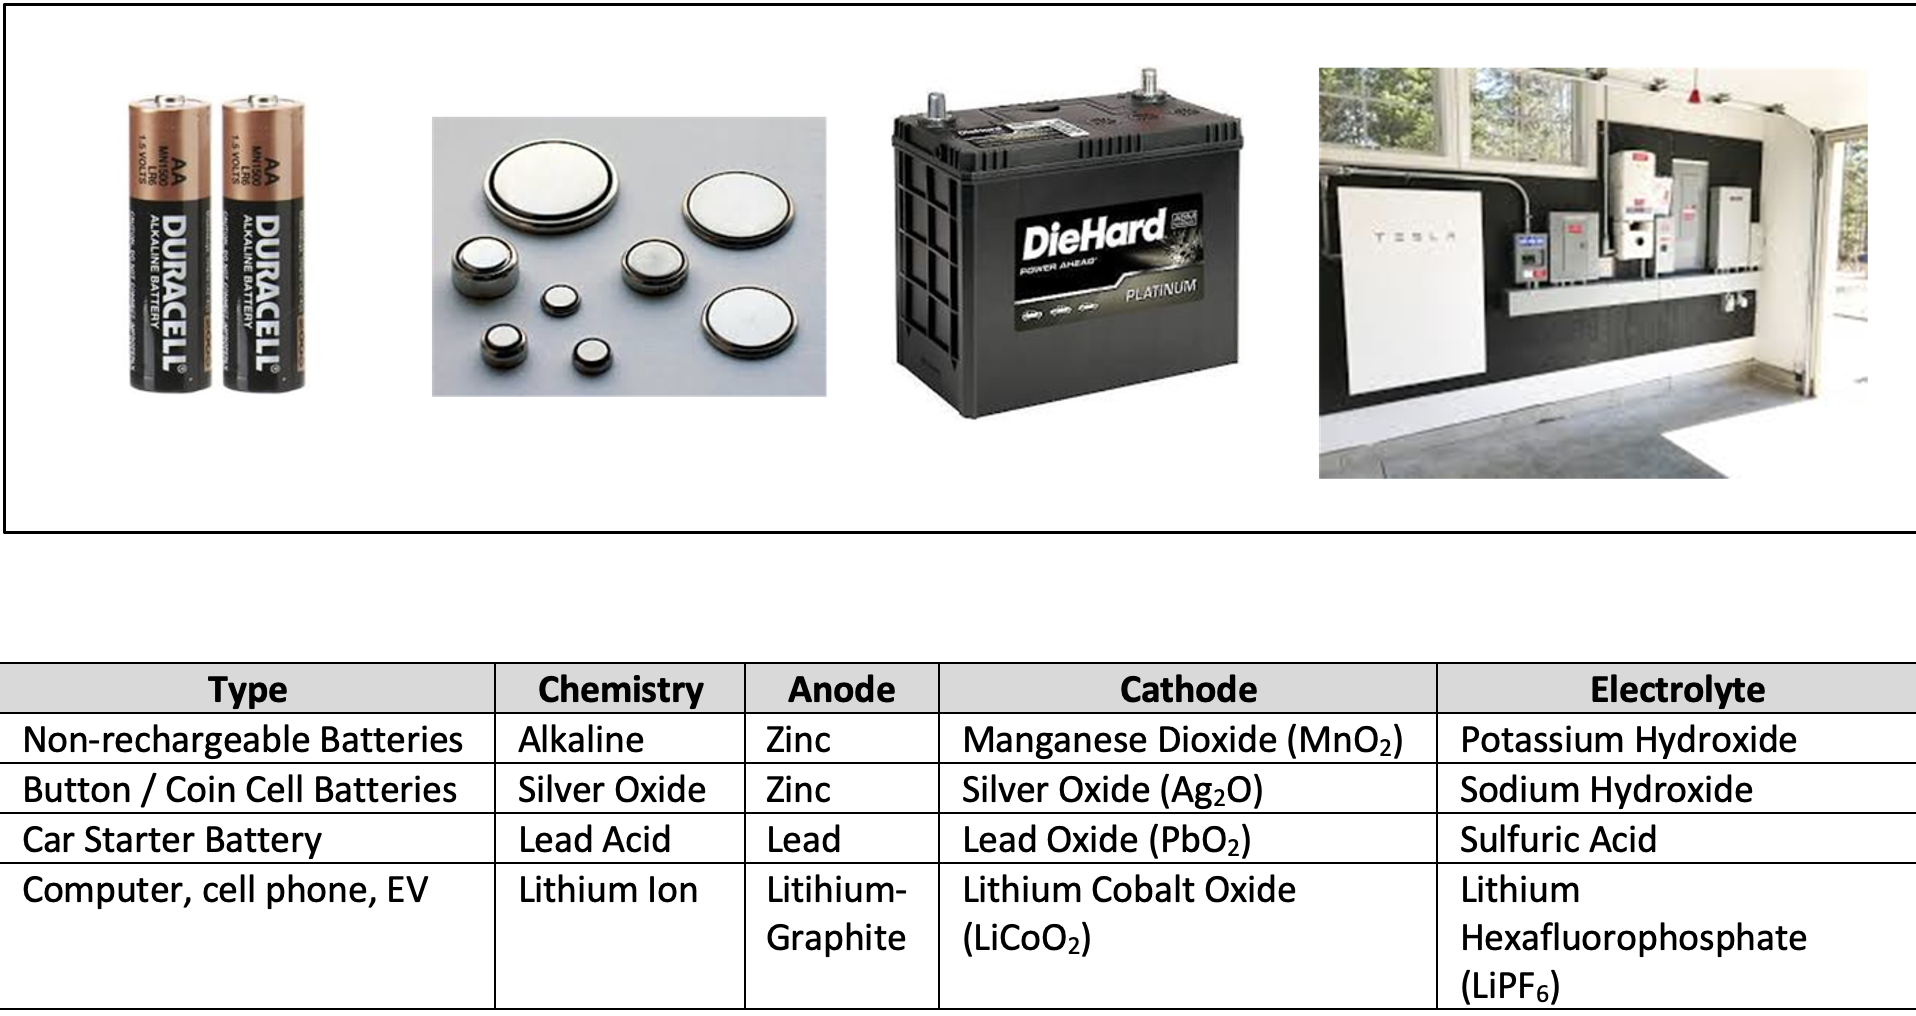
Figure 3.51: Common Batteries And Their Chemistries
Batteries are rated using has several different common units which can be confusing. Small batteries for consumer goods are often rated in units of Amp hours (Ah) or milliamp hours (mAh) is are measure of the electrical charge stored by the battery. This value is often printed directly on the battery and is useful for energy comparisons. This value is determined by the mass of active electrochemical materials contained in the battery. This is sometimes called the battery rating and represents the maximum amount of current over time that can be extracted from the battery under certain specified conditions. Amp hours are defined as the number of hours for which a battery can provide a discharge electrical current at the nominal voltage of the battery. The battery voltage drops throughout the discharging cycle, and as mentioned previously, a “dead” battery is simply one that doesn’t have enough voltage to run whatever device it is connected to.
The electrical energy storage of a battery in Wh (or kWh) can be approximated from the Amp-hour rating by multiplying by the rated battery voltage. This conversion can be understood based on the equations (3.24) and (3.25).
\[\begin{equation} P(W) = I(amps) \times V(volts) \tag{3.24} \end{equation}\]
\[\begin{equation} E(kWh) = P(kW) \times t(hr) = I \times V \times t = I \times t \times V = (Ah) \times (V) = Wh \tag{3.25} \end{equation}\]
For example, a 12-volt car battery with a 48 Ah battery provides electrical energy storage of approximately 48 Ah x 12 V = 576 Wh or 0.58 kWh. A more accurate approach takes into account the variation of voltage by integrating the Ahr capacity x V(t) over the time of the charging cycle. The actual energy storage capabilities of the battery can vary significantly from the rated capacity since the battery capacity depends strongly on the age, temperature, and past charging and discharging history of the battery. Most of us know this from experience and advice we may have heard in the past on how high to charge a phone battery or how low to let the battery go before charging.
```
Exercise.
The figure below shows a schematic with a residential solar array and battery connected to an inverter and house in a grid-connected system. The battery output is direct-current (DC) electricity like the solar panel so the inverter is required since the house and electrical grid use alternating-current (AC).
Considering this system, calculate how many 9.8 kWh LG batteries like the one in the schematic could McGinnis’ solar system fill in an average day? The system consists of 27 panels rated at 380 Wdc and a de-rating factor of 75%. Recall the average daily solar insolation in Roanoke, VA, is given by Is = 4.8 kWh/m2 day. Ignore inverter efficiency losses in your calculation.
Correct answer: 4 batteries
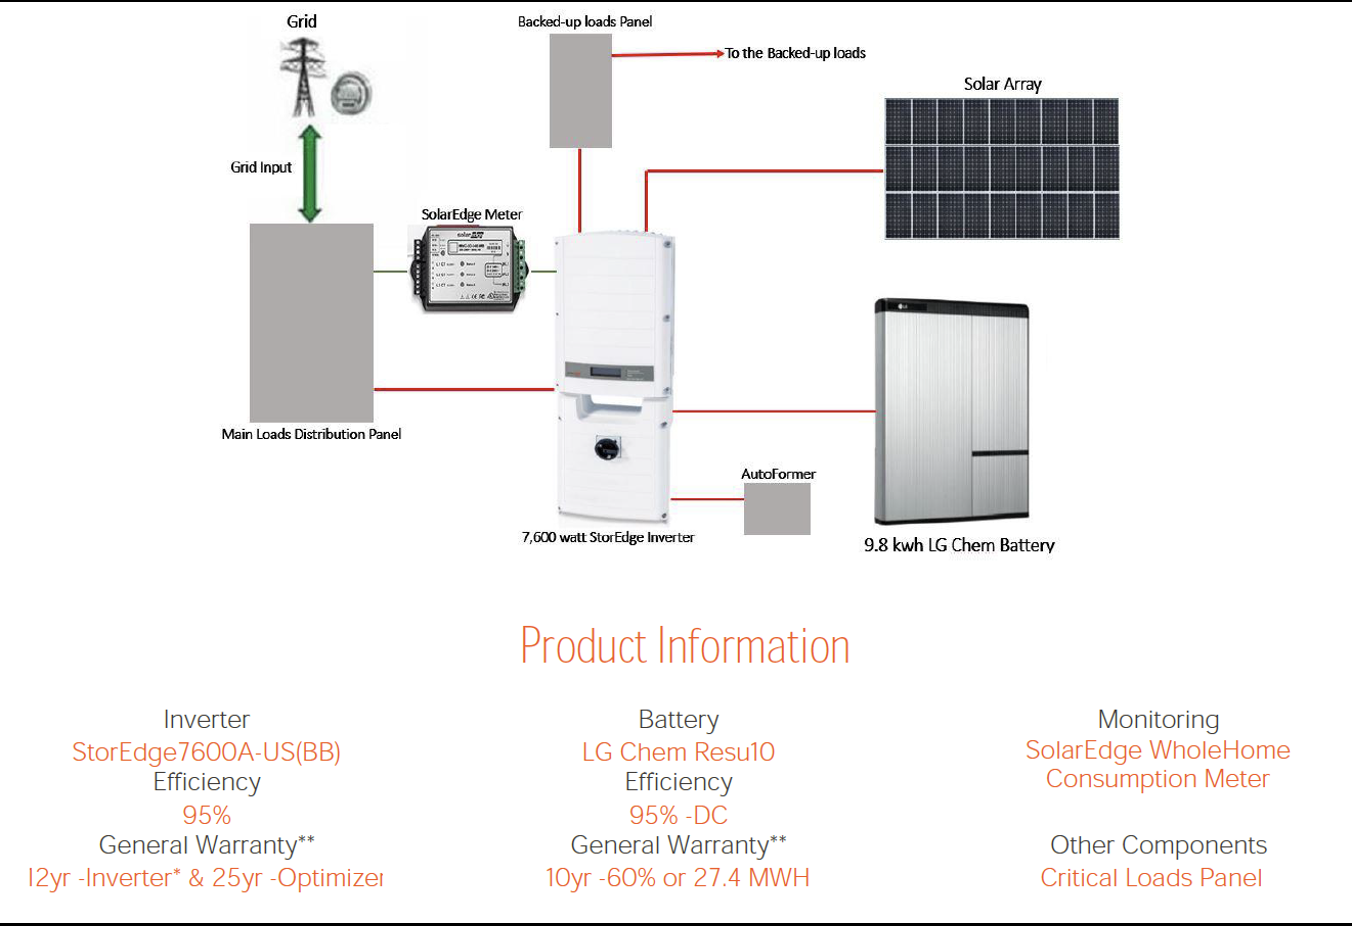
Figure 3.52: Residential Home Battery System with Solar Panels and Grid Connection.
The DOE Global Energy Storage Database provides detailed information on more than 2,000 grid-connected energy storage projects around the world as well as relevant state and federal policies. It contains interactive maps with energy storage projects which can be searched based on location, storage type, and other important characteristics.
Pumped hydropower is the largest source of energy storage in the US with over 94% of the capacity as seen in Figure 3.53. This technology makes up only a small portion of new energy storage projects since most high potential hydropower sites have already been developed in the US. The concepts discussed in the earlier renewable energy chapter for hydropower apply, but pumped hydropower has an upper storage reservoir (forebay) at higher elevation than the outlet (tailwater) which is a lower elevation lake or river.
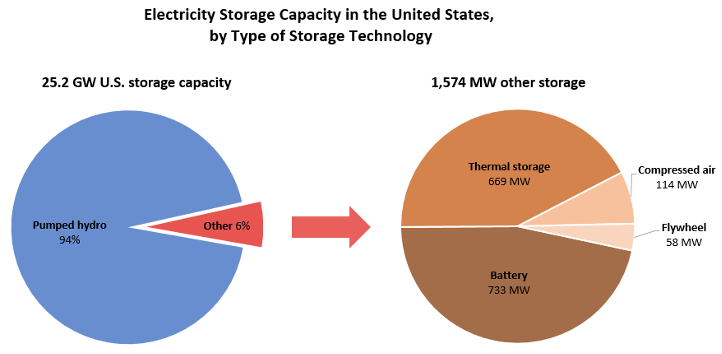
Figure 3.53: US Energy Storage Project by Technology Type in 2021. From: U/ Michigan Factsheets
Smith Mountain Lake is one example of a pumped hydropower systems and is shown schematically in Figure 3.54. This system has an upper reservoir in Smith Mountain Lake at an elevation of approximately 795 feet and a lower reservoir in Leesville Lake at an elevation of approximately 600 feet. Water that is stored in Smith Mountain Lake first passes through turbine-generators to produce electricity, primarily during peak usage hours, and is then discharged into Leesville Lake. Water is retained in Leesville Lake and can be pumped back during periods of low demand (low electricity cost to pump) back up into the Smith Mountain Lake for re-use later (sell electricity at high demand/higher cost). There are also generators on Leesville Lake for additional energy production.

Figure 3.54: Pumped Storage project within Smith Mountain Lake and the downstream section of the Roanoke River called Leesville Lake.
The storage capacity for pumped hydropower is considered large-scale and depends on the size of the upper reservoir and the elevation difference. The power capacity and electrical generation are limited by the number and size of the water penstocks and turbines.
Pumped hydropower is an effective means to store huge amount of energy and has many benefits. In locations where electricity has demand-pricing, also known as time-variable pricing (TVP), these systems are economically attractive since high-demand electricity can be sold at higher prices. When electricity demand is lower, often late in the evening or early morning, the electricity needed to pump the water back to the higher reservoir is done at lower prices so a net profit is made.
Pumped hydropower and other large energy storage systems also help with peak-shaving or load-sharing. Figure 3.55 shows electrical load with and without energy storage. On the left, demand for electricity is lower during the night and rises during the day. The shape of this demand curve depends on the location and types of energy demand (residential, commercial, industrial, etc.). Demand peaks, especially steep ones, are challenges for the grid which cannot easily handle quick increases and decreases in energy demand. Utility companies often have high demand charges for peak energy use as an incentive to get businesses and people to adjust their behavior since matching the peaks can require more power generation for just a few hours which is relatively expensive.
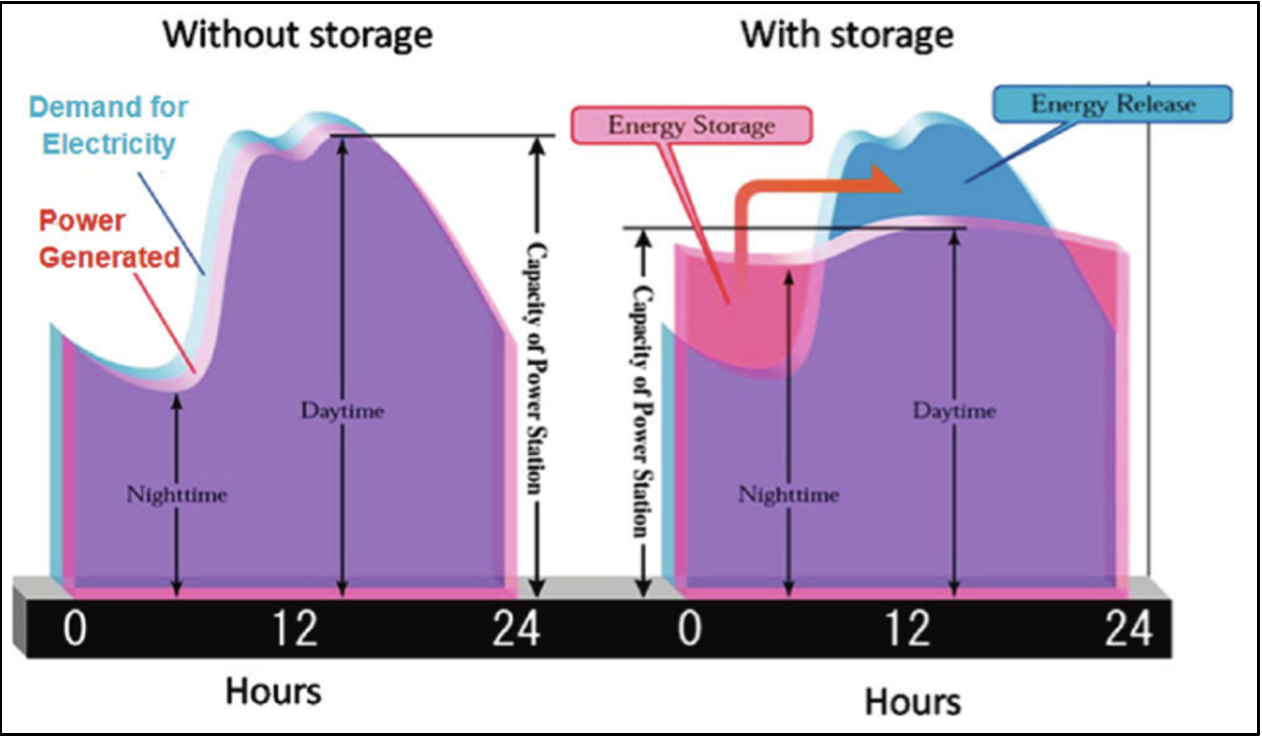
Figure 3.55: Storage, Electrical Energy. Source: IEC white paper, 2011. http://www.iec.ch/whitepaper/pdf/iecWP-energystorage-LR-en.pdf
A specific example is shown in Figure 3.56 for the “net electrical load” for a typical spring day in California which has increasing solar energy generation. This is the total demand for electricity minus whatever renewable energy is on the grid. On the left side of this curve, during the night and early morning hours, the demand is flat and handled by baseline energy generation which is often currently fossil fuel plants. In the case of solar energy, the load curve is lowered during the sunniest part of the day and the drop is higher over time as more solar panels are installed into the system. For other renewable energy technology, this demand reduction might happen at other times of day. As the sun is setting, solar energy is declining and people are getting home from work and turning on all lights, appliances, TVs, computer, etc. So, the net load rises very rapidly to an early-evening peak.
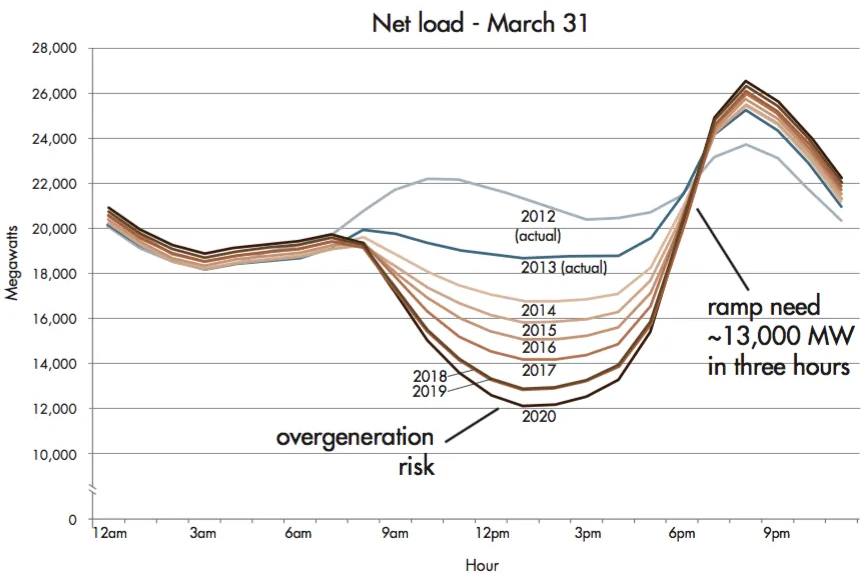
Figure 3.56: Peak Electricity Demand Curve. Source: https://www.vox.com/2016/2/12/10970858/flattening-duck-curve-renewable-energy.
Energy storage technologies can provide a lot of benefits to balance the electrical load. Pumped hydro, batteries, and other energy storage that have fast turned-on capability can drop the net load. This is called peak-shaving in which the energy storage provides electricity to reduce the peak demand so that additional energy generation with fossil-fuel power plants does not have to be started. Pumped storage is often used to peak-shave in the late afternoon and evening, then later in the evening the water can be pumped back into the reservoir at lower electricity rates. Also, some of the excess solar energy shown in the dip in the curves can be sent to storage rather than lower the demand. This flattens out the dip in the midday and the storage energy can be released a few hours later to shave off the peak. The balance of energy supply and demand is a complex system to optimize, but energy storage is an additional resource to help control the flow of electricity.
Exercise. Bath Count Pumped Storage Station
The largest pumped hydropower storage facility in the world, the Bath County Pumped Storage Station is also located in Virginia. The link provides an interesting video that talks about the operation of this unique power station.
System Information:
-
Net generating capacity is 3,003-megawatts (6 turbines)
-
The generators act as large electric motors and spin the turbines backward to pump water back to the upper reservoir overnight
-
License issued January 1977 and commercial operation began in December 1985.
-
The hydraulic gradient between the two reservoirs is 1,262 ft. Station also consists of a powerhouse and a tunnel system that connects to the two reservoirs.
-
During high demand, water flows to the lower reservoir at rate of up to 13.5 million gallons per minute
-
Pumping Water Flow: 12.7 million gpm (gallons per minute)
-
Water Level fluctuates 105 ft in upper reservoir and 60 ft in lower reservoir during operation.
-
Cost approximately $1.6 billion to construct
-
Lower Reservoir Dam is 135 feet high and 2,400 feet long, containing 4 million cubic yards of earth and rock fill.
-
Lower Reservoir consists of 555 surface acres and water level fluctuates 60 feet during operation.
-
Upper Reservoir Dam is 460 feet high and 2,200 feet long, containing 18 million cubic yards of earth and rock fill.
-
Upper Reservoir consists of 265 surface acres and the water level fluctuates 105 feet during operation

Figure 3.57: Bath County pump storage project is located on the border between Virginia and West Virginia. If you ever want to a go on a great gravel ride or 4wd adventure, there is a forest service road along the top of the ridge with some great views and challenging climbs.
The time frame over which energy storage systems can be discharged must be matched to the application and is a critical parameter when choosing the appropriate energy storage system. There is roughly an inverse relationship between discharge time and system power rating as seen in Figure 3.58. Pumped hydropower and Compressed Air Energy Storage (CAES) are at the upper right-hand corner of the plot with the largest system power ratings, but relatively long discharge times (hours) to access all of the energy. In these two cases, the water and air must flow out of the system to generate energy - this flow of kinetic energy from potential energy takes time and is dependent on the size of the pipes which limits the flow rate of water and gas. On the left-hand side, in contrast, are storage systems like supercapacitors which can provide energy on the order of seconds, but have lower much lower power capacity. Supercapacitor systems are a bit like higher power versions of the flash on your cell phone camera which happens very quickly but has limited energy.
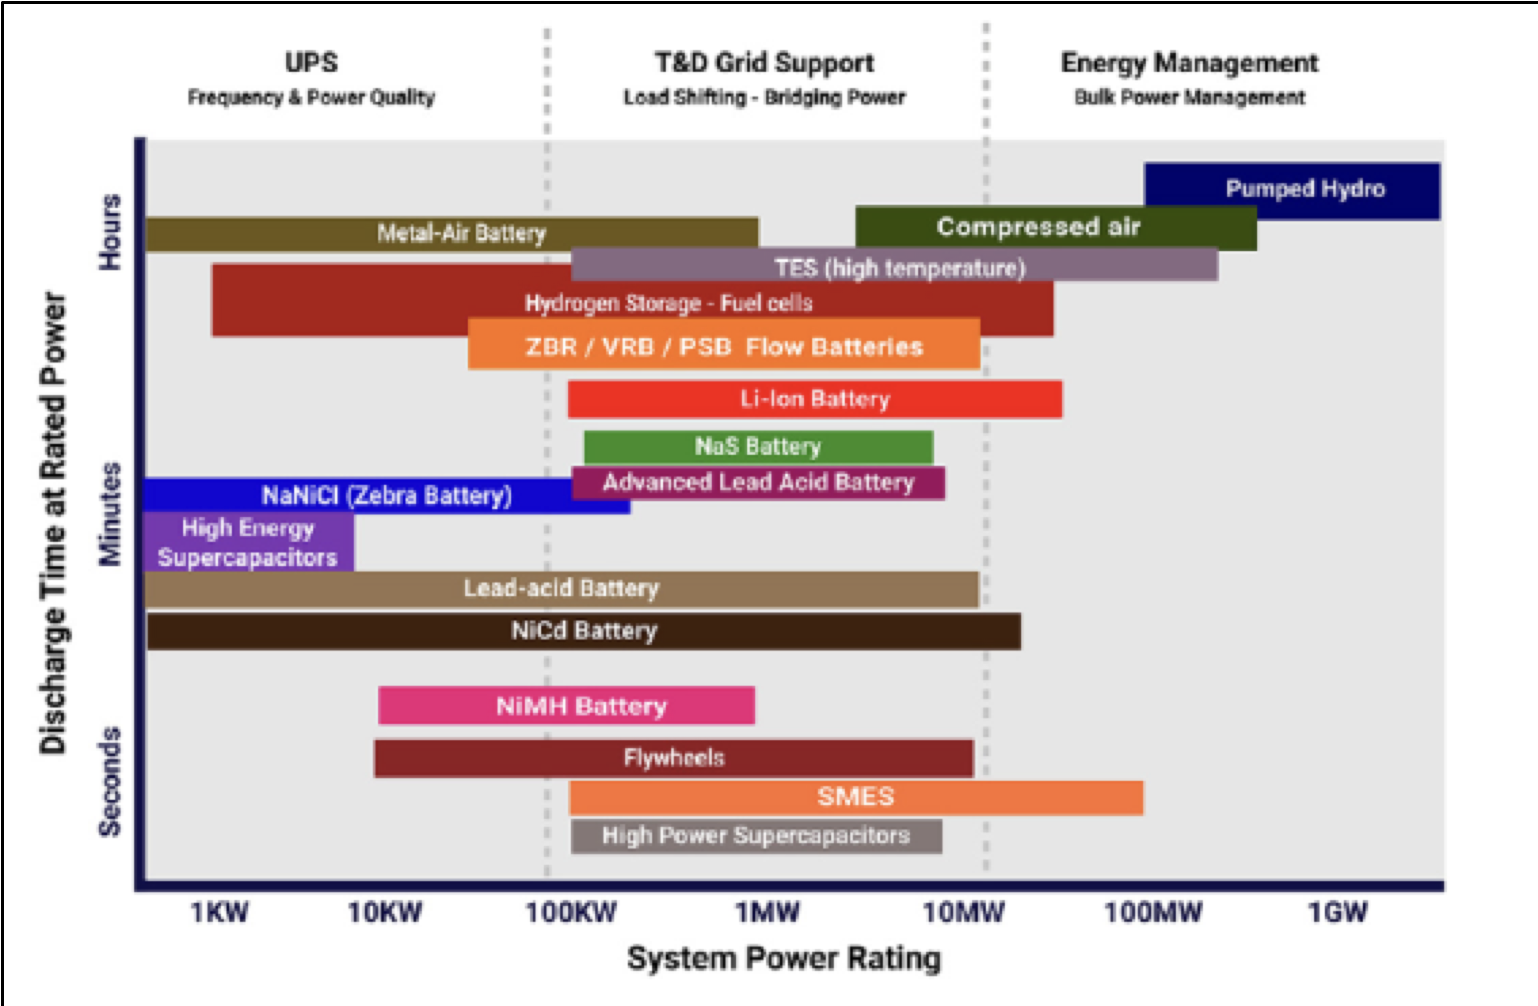
Figure 3.58: Energy Storage Technologies By Power Rating and Discharge Time. Source: M. Argyrou, et al. Energy storage for electricity generation and related processes: Technologies appraisal and grid scale applications. Renewable and Sustainable Energy Reviews 94 (2018): 804-821
The energy storage technologies, like many research and development projects, go through a development curve as shown in Figure 3.59. Technologies on the left side are in development which may or may not make it to commercialization like those on the right side which are advanced enough to be technologically and economically feasible. As examples, you will see hydrogen on the left side in the Development phase while pumped hydropower is fully Mature and commercialized as we have discussed.
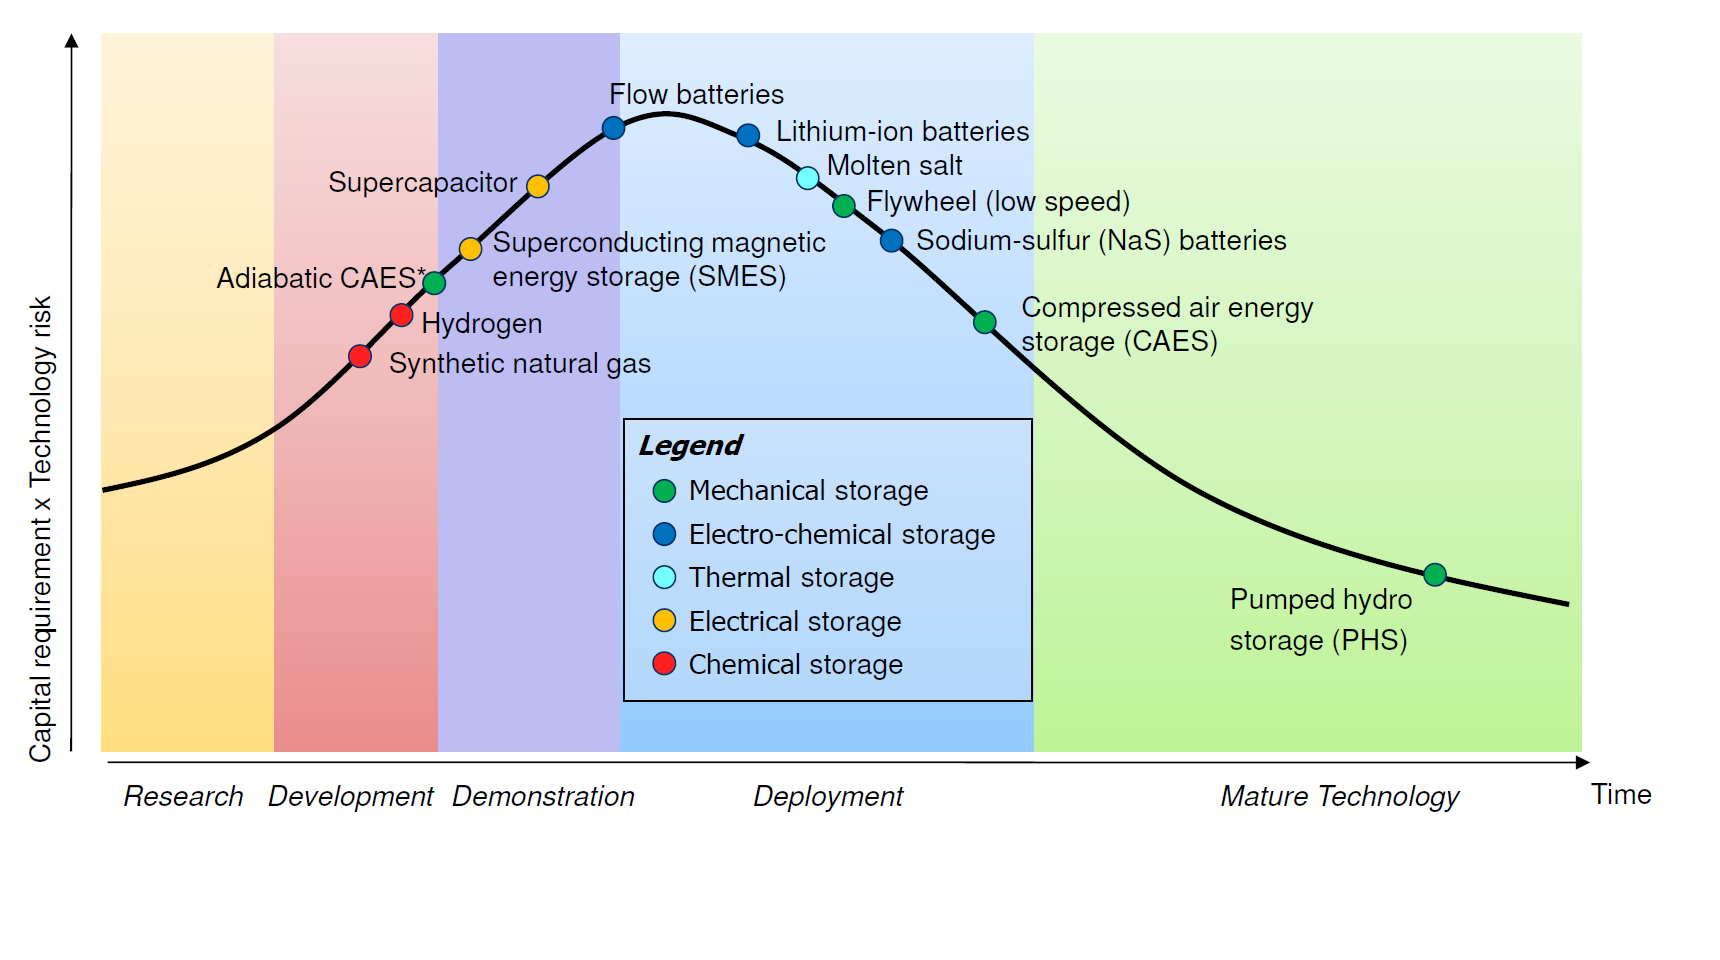
Figure 3.59: Technology Maturity Curve for Energy Storage Technologies. Source: Decourt, B., and R. Debarre. Electricity storage factbook. Schlumberger Business Consulting Energy Institute, Paris
Conversion of energy from one form to another necessarily means that there will be energy losses in these systems. In many cases, some energy is required as part of the storage process as well. Therefore, it is critical to minimize these losses which vary for different energy systems. The key metric for comparing energy storage losses is the roundtrip efficiency. The is the overall efficiency for the storage and release of a given amount of energy. It is defined as the ratio of net energy discharged to the grid to the net energy used to charge the storage system.
\[\begin{equation} EPS = \frac{E_{discharge}}{E_{recharge}} \tag{3.26} \end{equation}\]
For batteries, electricity is required to charge the battery either by the manufacturer for non-rechargeable batteries or at home with a charger for rechargeable batteries. Batteries also cannot discharge all of their energy when being used which leads to a small loss as well. Depending on the chemistry, and there are many types of chemical batteries, the roundtrip efficiency is in the range of 60 – 95%. For large scale utility battery storage, roundtrip efficiency is approximately 80% which is similar to pumped storage facilities as shown in Figure 3.60.
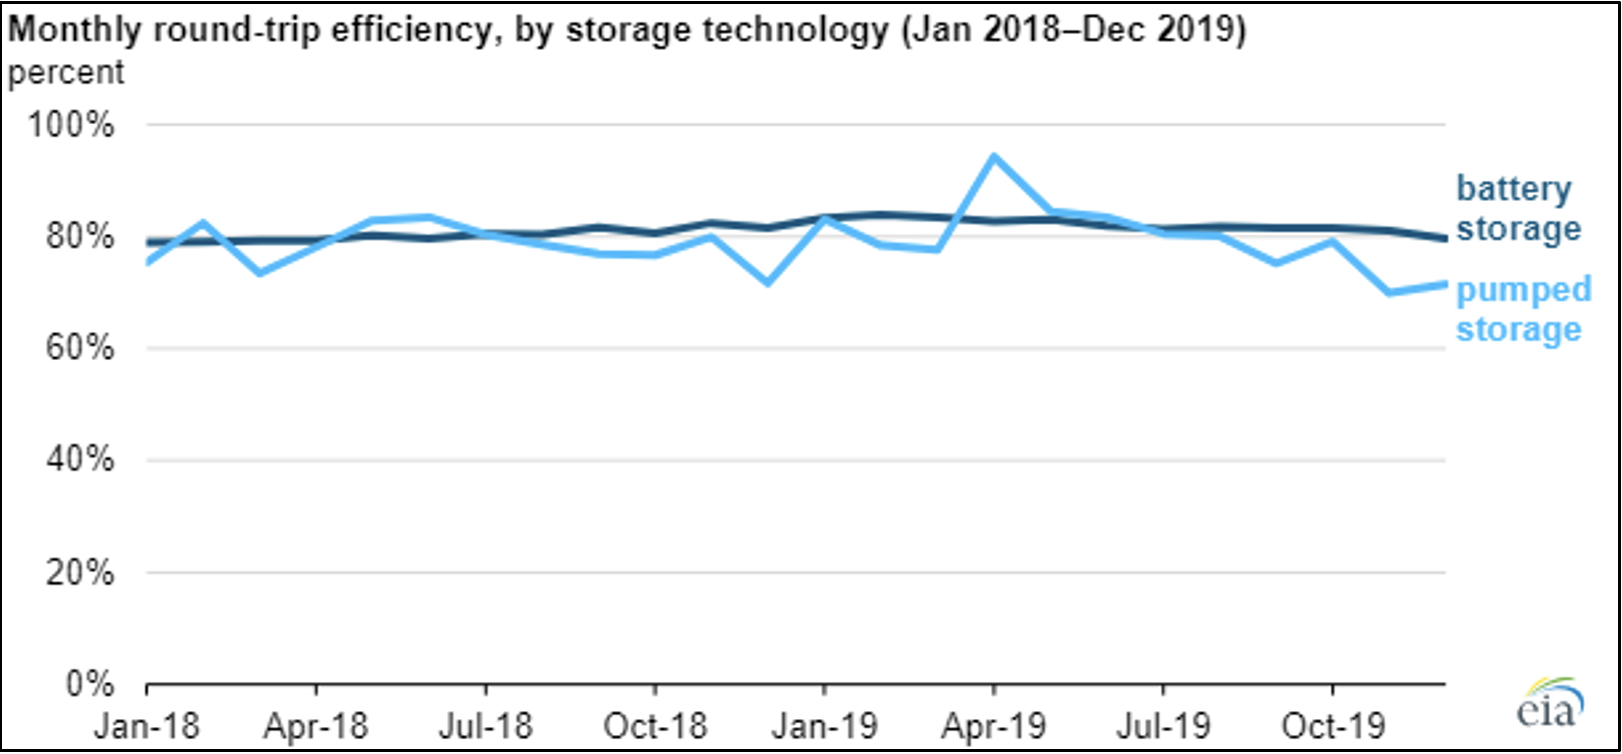
Figure 3.60: US Round Trip Efficiencies. Source: https://www.eia.gov/todayinenergy/detail.php?id=46756
Despite the relatively high roundtrip efficiency of 80% for these systems, note that they do add to the overall energy use. These systems are not generating any new electricity, but rather storing energy for later use. The electricity used to pump the water to higher elevations is higher than the electricity produced due to losses in the system when it is discharged. Impoundment hydropower has efficiency closer to 90% since energy is only lost in the release of water from behind the dam, and no energy was required to “collect” this reservoir of water.
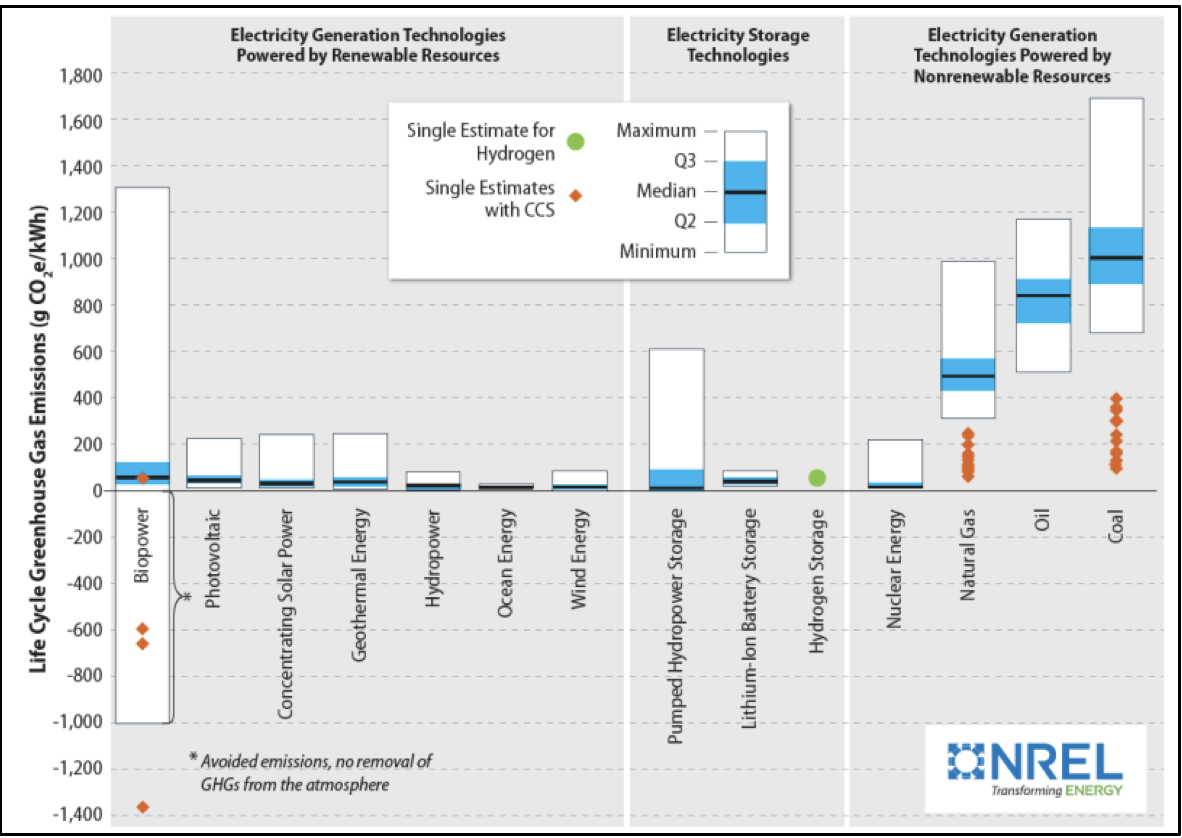
Figure 3.61: NREL Life Cycle GHG Emissions From Electricity Generation
3.3.3 Triple Bottom Line for Energy Storage Systems
Environmental issues for renewables are reduced in many aspects, but there are still impacts when considering the whole life cyle of these products rather than a narrow focus on the energy generation.
Carbon dioxide emissions and other air pollutants are not produced during the electricity generation phase for solars, wind, and hydropower as no fuel is being combusted.
3.3.3.1 Economics of Renewable Energy Systems
Simple payback times work as good esimates for lower costs sytems like residential solar PV Panels, especially when the panels are purchased outright and not financed.
In the decision making process, we will calculate a payback time on the capital investment (Figure 3.62). In simple terms, the payback time represents the number of years before we break even from the original investment. For renewable energy, the produced energy offsets the purchase of electricity from a utility. For energy efficient appliances and automobiles, the higher efficiency reduces the purchase of electricity, heating oil, or gasoline.
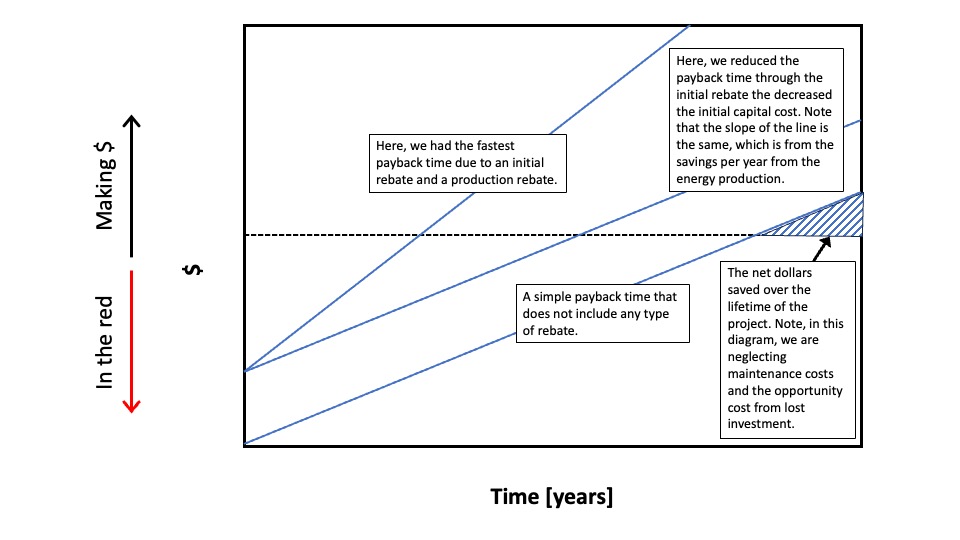
Figure 3.62: Simple backback time figure that illustrates time on the x-axis and dollars on the y-axis. The figure helps conceptualize how long it takes to break even under a scenrio with no rebates (the longest payback time), a scenario within a rebate on the capital cost, and the shortest scenario that includes an initial rebate and a yearly rebate based on annual energy production.
The upfront costs can also be subsidized through local, state and federal programs. These subsidies or rebates include offsetting the capital cost and/or payments based on the energy produced from renewable projects. The simple payback time equation is as follows:
\[\begin{equation} PaybackTime = \frac{C_{capital cost}}{S_{savings per year}-C_{operational cost per year}} \tag{3.27} \end{equation}\]
When rebates are included, the equation may include additional terms:
\[\begin{equation} PaybackTime = \frac{C_{capital cost}-Rebate_{capital}}{S_{savings per year}-C_{operational cost per year}+Rebate_{production}} \tag{3.28} \end{equation}\]
Wind turbine projects are much larger and costly and are financed over a number of years, a bit like a mortgage on a house. In this case, a much more sophisticated economic analysis is needed which includes maintenance and interest. Levelized cost of energy (LCOE) is the standard method for larger utility scale systems which allow for fair comparisons.
LCOE allows more accurate cost estimates compared to Simple Payback Time and uses more variables to compare large scale energy systems with different technology. It is an economic assessment of the cost of the energy-generating system including all the costs over its lifetime: initial investment, operations and maintenance, cost of fuel, cost of capital. A net present value calculation is performed and solved in such a way that for the value of the LCOE chosen, the project’s net present value becomes zero. NREL has a LCOE Calculator which uses the following equation and variables.
In this analysis, LCOE is the minimum price at which energy must be sold for an energy project to break even. Typically LCOEs are calculated over 20 to 40 year lifetimes, When comparing LCOEs for alternative systems, it is important to define the boundaries of the ‘system’ and the costs that are included in it. For example, should the analysis include transmissions lines and distribution systems, R&D, tax, and environmental impact studies, costs of impacts on public health and environmental damage, government subsidies, etc.? Another key issue is the decision about the value of the discount rate, I, for money. The value that is chosen for discount rate can often ‘weight’ the decision towards one option or another, so the basis for choosing the discount must clearly be carefully evaluated. The discount rate depends on the cost of capital, including the balance between debt-financing and equity-financing, and an assessment of the financial risk.
An example of LCOE calculations for a wind projects is shown in Figure 3.63. The FCR represents the amount of annual revenue required to pay the carrying charge15 as applied to the CapEx on that investment during the expected project economic life. The FCR is based on the capital recovery factor but also reflects corporate income taxes and depreciation.
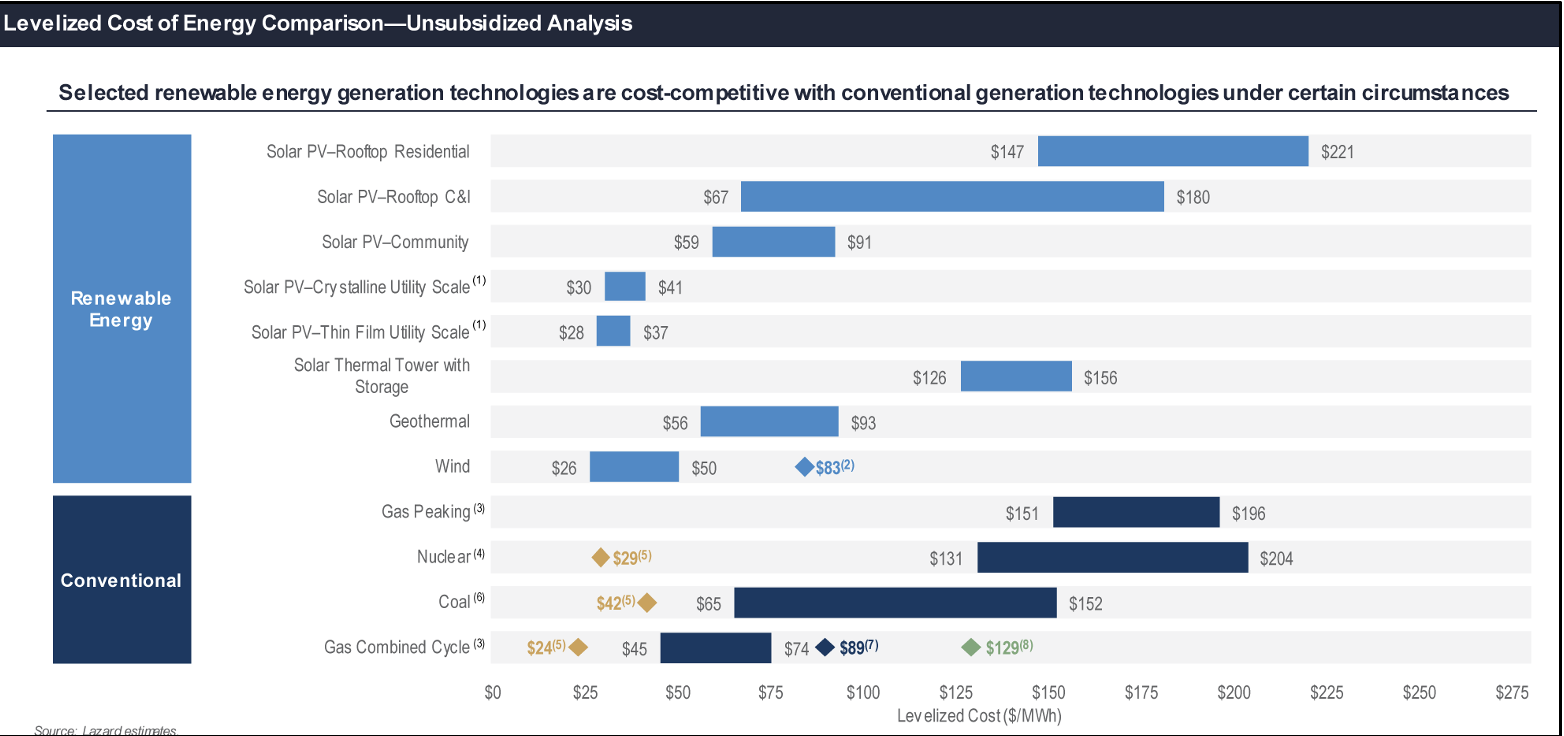
Figure 3.63: LCOE for Renewable and Conventional Technologies. Note to authors: update figure with new data