2 Introduction to Green Engineering Concepts
2.1 Background
Learning Objectives
- Describe and explain Sustainability: Definitions, Opportunities and Challenges
- Identify and give examples of Ecosystem Services & Natural Capital
- Summarize and sketch the Triple Bottom Line & Donut Concept
- Explain and give examples of Systems Thinking - Life Cycle Phases
- Describe Sustainability tools – Materials Flow Analysis (MFA) and Life Cycle Assessment (LCA)
This chapter provides an overview of the overarching concepts which apply to all topics in this introductory Green Engineering textbook and course. The concepts of systems, energy/materials flows and balances, environmental impacts, the Triple Bottom Line, natural capitalism, ecosystems service, and life cycle thinking will be introduced here and applied throughout the rest of the course. You should be actively trying to make connections between these fundamental concepts and the topics in the following chapters.
Key Questions
- Give an example of a product, process, or system design that did not consider green engineering concepts and the resulting environmental impacts. Suggest a specific green engineering concept that could potentially improve this situation.
- Give an example of Natural Capital. Explain why natural capital is important in Green Engineering and list specific challenges to considering it properly in engineering decisions.
- Give an example of Ecosystem Services. How are ecosystem services valued and why is this important in Green Engineering?
- Give an example of a product that has specific benefits in each aspect of the Triple Bottom Line.
- Give a specific example of how LCA can assist in making green engineering decisions.
2.1.1 Primer: Definitions
- Donought (donut) Concept = Similar to the TBL, the donut (british spelling is donought)is a framework for considering sustainability which has minimum basic societal needs on the inside and environmental limits on the outside leaving a “sweet spot” for development in the middle.
- Ecosystem Service = An ecosystem service is any positive benefit that wildlife or ecosystems provide to back to people and society.
- FEWS = An acronym that stands for the Food-Energy-Water system. FEWS highlights the interdependence of each system such that they’re considered holistically to improve the human condition for all both now and for future generations.
- Green Engineering = the design of materials, processes, systems, and devices with the objective of minimizing overall environmental impact over the entire product/project life cycle while meeting other required performance, economic, political, and societal constraints (this is more of a perspective for this course than formal definition).
- Life Cycle Assessment (LCA) = a formal methodology to quantify a variety of important environmental impacts across all phases of the life cycle.
- Life Cycle = the phases required over the full stages of a product/process/or system lifetime including extraction, manufacturing, use, and end-of-life.
- Materials Flow Analysis (MFA)= a formal methodology to quantify all inputs and outputs in any life cycle and a requirement for a full LCA.
- Natural Capital = the stock of renewable and non-renewable resources (e.g. plants, animals, air, water, soils, minerals) that combine to yield a flow of benefits to people.
- Systems Engineering = engineering design and analysis which considers the whole system and the interconnections rather than just the individual components.
- System Engineering = “Systems engineering seeks a safe and balanced design in the face of opposing interests and multiple, sometimes conflicting constraints. The systems engineer should develop the skill for identifying and focusing efforts on assessments to optimize the overall design and not favor one system/subsystem at the expense of another while constantly validating that the goals of the operational system will be met.” – NASA, https://www.nasa.gov/reference/2-0-fundamentals-of-systems-engineering/
- Sustainability = In 1987, the United Nations Brundtland Commission defined sustainability as “meeting the needs of the present without compromising the ability of future generations to meet their own needs.”
- Triple Bottom Line (TBL) = In 1994, John Elkington(https://www.investopedia.com/terms/t/triple-bottom-line.asp) as his way of measuring performance in corporate America. The three components of the TBL are the environment, society, and economics. The idea was that a sustainability company should be managed in a way that not only makes money but which also improves people’s lives and the well-being of the planet.
2.2 Green Engineering - What, Why, and How?
To start this textbook, it’s worthwhile to breakdown the scope and idea of Green Engineering as it is not a traditional engineering field and major like Mechanical Engineering, Chemical Engineering, etc. which have a reasonably defined scope that has been developed over the past century.
“Green”, in recent decades, is associated with the environment and more specifically with products and services which are considered to be better for the environment. Unfortunately, this term is used quite loosely and often without much data or analysis to confirm the environmental benefit.
Engineering, broadly speaking, is the application of math and science to develop solutions for the needs of society. Throughout human history, engineers have played a key role to design and build the world around us. Engineering successes over the past several centuries have increased the quality of life for hundreds of millions of people through improvements and innovations in infrastructure, health, communication, education, food security, and many other areas of society. Our modern society is built upon engineering successes that many people take for granted including air conditioning, telecommunication, synthetic fertilizer, pharmaceuticals, electronics, transportation, and the list goes on. We should not overlook the benefits to society provided by engineering, and also need to acknowledge the consequences of engineering has been implemented.
In combining these two terms, Green Engineering becomes the application of engineering through an environmental lens. At its core, Green Engineering uses data and analysis from traditional engineering (in all engineering fields) and applies it more broadly across systems and the life cycle to consider the environment as a consideration for design.
While some engineering fields and engineers have already been considering environmental impacts over the years, this has not been a primary consideration in engineering for most of the last century; performance and profit have generally been considered more important when weighing criteria for engineering designs. You have likely heard of the term the “bottom line”, an economic term which typically refers to maximizing profit in a given situation. However, a focus primarily on profit can lead to a variety of problems which we see in the news all the time including environmental problems, safety issues, and worker exploitation. Two examples in the Midatlantic are 2 natural gas pipeline projects that went through approval in the late 2010’s. The Atlantic Coast Pipeline was cancelled following litigation related to Environmental Justice. In contrast, the Mountain Valley Pipeline was completed in 2024 over 3-years behind schedule with multiple water-pollution violations.
Related to Green Engineering is the term “Triple Bottom Line” (TBL) which was first used in 1994 to include environmental considerations in business (Elkington (1994)). It is now commonly used in the corporate world in the context of sustainability and balancing Environmental, Economic, and Social goals. The TBL is often depicted as 3 intersecting circles representing the environment, the economy, and society as shown in Figure 2.1. This diagram indicates these categories are interconnected with areas of overlap between these considerations. For sustainability, engineers should consider each of these categories, noting that some situations will have significant overlap in only two of the three categories.
The EPA’s version of the TBL is the 3P program where the P’s stand for People, Planet, and Prosperity (renamed from early version of Profit). The EPA has administered the 3P student grant program since 2004 which has provided more than $18M in funding for over 800 projects throughout the US and Puerto Rico.
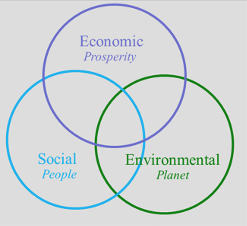
Figure 2.1: The Triple Bottom Line includes 3 interconnected areas for consideration in sustainablity: people, planet, and profit.
Light-emitting diode (LED) lights are a good example of the TBL in that they have a significant benefit of 90% less energy use for the same amount of light (lumens) than incandescent light bulbs. They also have a much longer lifetime often lasting for more than 20,000 hours compared to approximately 1,000 hours for incandescent light. There is a direct relationship between environmental impact, lifetime, and energy usage as we will discuss in the energy chapter. Less energy use means less mining and fewer air pollutants which, in turn, give health and ecosystem benefits to society. LEDs also have economic benefits because they save utility costs over time due to their energy savings even though their upfront cost is higher.
One economic metric for lifetime costs is the Payback time, the amount of time to payback an upfront cost due to future savings. This is an important concept that we will discuss for many green engineering topics in future chapters. Most products with energy benefits have a higher initial cost due to advanced technology, design, or materials. The energy savings make up for this additional cost over time. The simplest equation for payback time is shown below:
\[\begin{equation} \text{Payback Time}\left[ yr \right] = \frac{\text{Initial Cost}\left[\$]\right]}{\text{Savings} \left[\frac{\$}{yr} \right]} \tag{2.1} \end{equation}\]
where Payback Time = years to break even, Initial Cost = capital investment in [$], and Savings = dollars saved per year of operation \(\frac{\$}{\text{yr}}\) assuming no annual maintenance or operational costs.
The payback time for LED light bulbs depends on a number of factors (bulb cost, electricity cost, bulb efficiency, number of hours used per day), but is generally just a couple of years and can be less than a year for highly used bulbs in areas with expensive electricity costs. Throughout the modules in this course, we will discover a wide range of payback times.
You might have read in early August 2023 that the incandescent light bulb, invented by Thomas Edison in 1879, has been banned in the US. A brief history of the incandescent light bulb along with an interactive time line of other lighting technology advances is provided by the Department of Energy (https://www.energy.gov/articles/history-light-bulb). This is an example of interconnection of engineering, policy, and politics. For context, Europe phased out most incandescent lights in 2012.
It is not true that incandescent bulbs are explicitly banned, but the new Department of Energy rules enacted by the Biden Administration, essentially mean that this type of bulb will not be available with a few specific exceptions (https://www.energy.gov/articles/biden-administration-implements-new-cost-saving-energy-efficiency-standards-light-bulbs). The new rules require a minimum standard of efficiency for these bulbs - 45 lumens per watt. Efficiency, as we will see throughout this course, is defined as energy output divided by energy input. In this case, 45 lumens are a measure of light output and watts are a measure of electricity input. Incandescent bulbs are inefficient because they generate significant amounts of heat in addition to light as most people know from the experience of accidentally touching an incandescent bulb that has been on for some time. With these new rules, the Department of Energy (DOE) estimates through energy modeling that consumers will save approximately $3 billion per year on their utility bills. Additionally, over the next 30 years, these changes are projected to reduce carbon emissions by 222 million metric tons. There are also materials savings since LED lightbulbs also last 25 to 50 times longer than incandescent bulbs.
It is important to note that Figure 2.1 is just one representation of the TBL and not the only way to visualize the interconnection between these 3 factors influencing sustainability. The Venn diagram implies that each of the factors is equally important, which may not be true for all stakeholders or from all perspectives. For example, stakeholders with a strong environmental focus may believe that the TBL schematic in Figure 2.2 better represents the relationships between these factors. In this image, the environment is the most important system which encompasses both society as a secondary factor and then then the economy. Conversely, stakeholders with a strong economic interest may view these relationships the opposite way, arguing that without a strong economy supporting the system neither the environment nor society can function.
These examples show that it’s important to realize that there are different ways to view the world, each based on some truths, but none necessarily better or more correct than others. The key is to understand that each of these factors is important, but to a different degree to different stakeholders. Throughout Green Engineering, we will discuss the importance of tradeoffs like this and ‘getting everyone to the table’ by including stakeholders that have different perspectives and different lived experiences, which will result in more options and better solution to balance the TBL.
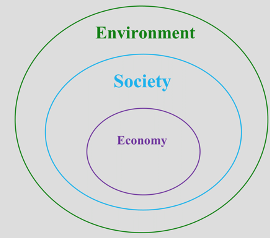
Figure 2.2: The Triple Bottom Line includes 3 interconnected areas for consideration in sustainablity: planet, people, and profit.
This course on green engineering is narrower than the TBL with a focus on the environmental impacts related to engineering analysis and design. The other TBL factors will be discussed less through examples in this text and in class discussions.
The concept of Green Engineering as its own field was introduced in the early 2000’s after decades of academic interest and discussion. Arguably the most important paper in these early days was the 12 Principles of Green Engineering which laid out a set of design principles that work as a guide for considering the environmental impacts of engineering as well as the opportunities to minimize them. These principles are summarized in the box below. You are encouraged to review this journal article to see additional examples and to think about the implementation of these principles in your specific field of study.
We will come across many examples of these Green Engineering principles throughout the semester, so have them in mind and keep an eye out for their application. It is also important to realize that not all engineering projects and technologies can apply all principles. These principles are better thought of as a checklist to mentally work through for all new engineering projects to look for opportunities for environmental improvement.
12 Principles of Green Engineering Anastas and Zimmerman (2003)
- Inherent Rather Than Circumstantial
- Prevention Instead of Treatment
- Design for Separation
- Maximize Efficiency
- Output-Pulled Versus Input-Pushed
- Conserve Complexity
- Durability Rather Than Immortality
- Meet Need, Minimize Excess
- Minimize Material Diversity
- Integrate Material and Energy Flows
- Design for Commercial “Afterlife”
- Renewable Rather Than Depleting
Note the use of the word “design” throughout this list of green engineering principles. The design phase occurs at the very earliest stages of most engineering projects. This is the point that generally offers the biggest opportunities for environmental improvement since it defines the flows of materials and energies to satisfy the engineering (and other) design constraints. Design choices that do not carefully consider the TBL over the full life cycle can lead to unintended consequences over time and complex environmental problems that can persist for decades or longer. Examples of this include buildings with low efficiency that use more energy than necessary for decades, nuclear power waste products that are radioactive for thousands of years, and hazardous chemicals that leach into rivers and soil and persist for decades.
At the end of the day, it’s important to say that there is no single definition for Green Engineering. At Virginia Tech, we have used the following working definition for the past 15 years.
“Green Engineering” is the design of materials, processes, systems, and devices with the objective of minimizing overall environmental impact over the entire product/project life cycle while meeting other required performance, economic, political, and societal constraints”.
This definition includes the TBL categories discussed above and several additional critical considerations (technical performance and politics) for a successful design. It also includes systems and the life cycle which are key concepts throughout this course. As you will realize with a bit of reflection, all engineering and design requires materials and energy to be taken from the environment so it’s impossible to engineer systems with zero impact. The goal, instead, is to reduce and minimize these environmental impacts while carefully considering the tradeoffs between the impacts that remain.
Where does your major fit into Green Engineering? This is a good time to pause and think about how your profession incorporates concepts related to Green Engineering. For example, Ecological Engineers harness Nature’s power to proactively minimize coastal flooding, which directly relates to Green Engineering Principle #2.
Think of a Green Engineering technology that you are interested in. This technology can be in any field or area. For the technology/product/process, answer the following questions:
-
Image(s) or schematic(s) of the technology that helps the reader understanding something about it.
-
Brief description of why this is considered “green engineering”
-
Status of the technology - implemented, R&D, conceptual?
-
Advantages and disadvantages with some justification
-
Specific major hurdles (technology, behavior change, cost, etc) required for extensive implementation and use
2.3 Systems and Systems Thinking:
A system can be considered as “a set of things working together as parts of a mechanism or an interconnecting network.” The key to systems is “working together” which indicates a dependency of some factors on others.
An automobile is a good example of a complex system. It is comprised of many different parts including an engine, chassis, exhaust, tires, etc. that are interconnected to provide a product that provides transportation services. It is common, and often useful, to divide systems up into individual components. Engineers are often tasked with designing and optimizing the components of a system. For the auto example, it is typical for mechanical engineers to work on the engine and chassis, electrical engineers on the control system, polymer engineers on the tires, industrial system engineers on the manufacturing process and flow, and so on. While there are clear advantages to breaking a system down into manageable and discrete components, it is also critical to consider the automobile as a system with interconnected parts. This is “systems-thinking” and it is important since the system design and operation depend on the interaction of the components. The engine cannot be optimized for fuel economy without considering the fuel, the engine materials, the fuel-oxygen ratio, the firing of the spark plugs, and the exhaust. As an engineer, it is easy to focus on the component level issues rather than to see the bigger systems issues – frankly, many engineers have jobs which are very narrowly focused on components. Systems thinking requires careful consideration of all the parts of a system and how they interact. This holds true for all sorts of systems that we will discuss from building systems to food systems to ecosystems to earth systems.
In Green Engineering, systems thinking considers all parts of the life cycle for a product or process. It begins with extraction of raw materials, manufacturing, use, and disposal which comprise the life cycle of products, processes, and systems. Without these considerations, improvements in some aspects of the system could be offset by other negative consequences. For example, carbon fiber panels can be designed and used for an automobile or aircraft to reduce fuel usage in the use phase due to the lighter vehicle weight. However, these panels are made from fossil fuels in the manufacturing phase and the fiber-polymer composite is not recyclable at the end-of-life of the vehicle. Whether this design change is better for the environment depends on the degree of damage for the fuel emissions compared to the fossil fuel extraction and manufacturing as well as the disposal issues for non-recyclable components. A detailed quantitative analysis is required to determine which design choice is better overall across the life cycle.
The schematic in Figure 2.3 shows the primary steps in the life cycle of a product. Raw materials are extracted from the earth to make everything. This includes minerals for all of the metals, glasses, and ceramics used in society. Fossil fuels - coal, oil, and natural gas – are extracted for their inherent chemical energy content which is generally obtained through combustion of these carbon-based fuels with oxygen to generate heat, carbon dioxide, water, and other pollutants. Oil and natural gas are currently also the primary raw materials for almost all industrial plastics. We also extract biomaterials such as wood, fibers, food, and plants that we convert into other products. Many of these raw materials are nonrenewable meaning they won’t regenerate within a time period relevant for human societies. This is true for all fossil fuels, metals and minerals which have a finite supply on earth. Raw materials are manufactured into usable products which often require energy or additional input for this use. At the end of a product’s lifetime, it is disposed. Not explicitly shown in this figure are the transportation steps to move the raw, intermediate, finished, and waste products between these phases.
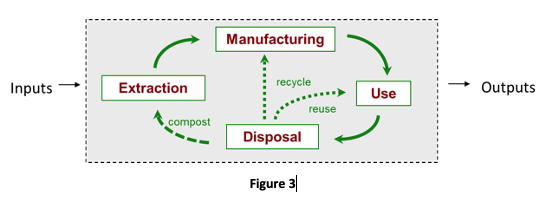
Figure 2.3: The Triple Bottom Line includes 3 interconnected areas for consideration in sustainablity: people, planet, and profit. Figure from S. McGinnis.
While this life cycle concept probably seems obvious to you now that it has been defined explicitly, the complexity of the life cycle has rarely been understood and considered carefully by engineers for design. The general public has even less understanding of product life cycles and society is therefore mostly unaware of the serious impacts for most of the products and processes they use. Everything that you see around you has myriad upstream and downstream inputs and outputs which all have environmental, societal, and economic impacts.
Pick an object that has some personal meaning to you. Make a list of all the raw materials and processes required to get that object into your hands. Consider not only the materials inputs/outputs, but also where they come from in the world, how much energy it takes to obtain and convert them into a useful form, all the transportation required, and all the people who work to produce this item and the systems that support it.
Figure 2.3 has intentionally been drawn in a circular manner. For most engineered systems, the life cycle is currently designed as a linear system in which materials are extracted from the environment for manufacturing and use and then disposed, often in landfills or by incineration. This linear flow of materials is often called Take-Make-Waste economy. This type of design is both intentional and inherently wasteful. It ends either with useful materials incinerated to produce energy and air pollution or potential raw materials and embodied energy buried in the ground.
In contrast to this, green engineering promotes a so-called Circular Economy in which materials are reused, remanufactured, refurbished, recycled, or composted (biological materials only). The most recognized of these circular flows – recycling, reuse, and composting - are indicated by dashed lines in Figure 3. This circular flow of materials in a system is much more efficient and sustainable from both a raw materials and energy perspective. Materials are reused rather than extracting additional virgin materials and embodied energy – energy used upstream to convert raw materials to useful materials – is not lost. However, the circular economy requires a change in mindset with much more effort spent at the design phase of the system.
For example, Design for Disassembly is a circular economy philosophy and method to increase the opportunities for remanufacturing, refurbishing, and recycling of multi-component items. This option is reduced significantly, or completely, if a product is not intentionally designed to be quickly and easily disassembled. Consider an aseptic juice box (Figure as an example. This packaging is engineered as a laminate with cheap and lightweight paper for structural integrity, a thin metal layer to prevent oxygen diffusion into the package and spoiling of the contents, and inner and outer plastic layers to protect the paper from moisture damage. This package can safely store food products without refrigeration for extended time period and the associated energy savings is a significant environmental and social benefit in countries with limited refrigeration. After use, the paper in this package could be composted, the metal and plastic could be recycled, but the design glues these layers together so they cannot be easily separated in an economically feasible manner. This means that current juice boxes will end up in landfills where they will remain for hundreds of years or more.
It is easy to forget that all of society’s waste and waste handling processes have been designed by us. Without intentional design, it becomes easy to produce products with limited or hazardous end-of-life scenarios. Most design engineers are not trained to think through the life cycle to the end-of-life for their products and processes. Natural ecosystems, in contrast, are inherently circular. Have you ever been hiking in the woods and come across a trash dump from the all of the animals and plants in nature? No, because nature doesn’t work in that way and ecosystems have evolved so that the waste of one species is an input for another species. Moreover, native cultures around the world practiced the circular use of materials before engineering and societal practice embraced a mindset of unlimited materials and disposable products.
Jack Johnson, a singer-songwriter, wrote the 3 Rs song in 2006 for the movie Curious George. The song starts off with “Three, it’s a magic number. Yes it is, it’s a magic number. Because two times three is six. And three times six is eighteen. And the eighteenth letter in the alphabet is “R””. The song goes on to describe key concepts within Green Engineering – reduce, reuse, and recycle. Do you remember hearing this song as a kid? Here’s a youtube link featuring Jack Johnson during an outreach event. What I really like about this song are the simple, relatable suggestions to the audience that provide each of those kids with something they can each do – like bring a bag to the grocery store. Not all green engineering has to been advanced technology, and all of us have a role to play to improve the environment. In your discipline, what is an example of the 3 R’s?
Reduce, the most important green engineering action in the 3Rs, does not show up explicitly in the life cycle diagram of Figure 2.3. It is there implicitly, though, as part of both the Inputs and the Outputs of the system. Reducing the amount of input in the form of materials, energy, and water leads to the biggest reduction in environmental impacts since the entire life cycle impact is reduced. Reducing inputs reduces proportionally all of the energy, ecosystem damage, chemicals, etc. required for extraction of the raw materials. Further, it reduces the energy and processing inputs for manufacturing and fuels for transportation between the phases. For vehicles it also reduces the amount of fuel required in the use phase as this is also proportional to the mass of the vehicles. And, at the end-of-life, it reduces the amount of waste. Reduction turns out to be one of the best practices for green engineering improvements, but careful design is required to have the same performance with fewer inputs and outputs.
2.4 Sustainability Tools – MFA & LCA
Two key sustainability tools related to Green Engineering are Materials Flow Analysis (MFA) and Life Cycle Assessment (LCA). These will be mentioned briefly throughout this course, but the details and practical implementation are left for other courses.
Materials Flow Analysis (MFA) quantifies all inputs and outputs in any life cycle as depicted in Figure 2.3. For products, processes, and systems, the quantified amounts of raw materials, energy, chemicals, and water are tracked in order to follow their flow through the system. This quantification allows for a better analysis of environmental impacts as well as the scale of the opportunities for each flow. Without these flows, we must rely on our intuition about products using a “a lot” of materials or “exorbitant” amounts of energy or “unsustainable” water use. Quantification also provides a more transparent method of comparing different products and minimize “green-washing” in which marketing statements are used to make a product appear to be better than alternatives from an environmental perspective.
Life Cycle Assessment (LCA) utilizes the MFA information and extends it further to quantified environmental impacts. For most decisions on sustainability, it is not enough to know the amounts of the materials flowing through the system: the amount of environmental impact that these flows are creating is a better metric. LCA translates amounts of inputs and outputs into measurable environmental impacts. For example, LCA converts kilograms of metals, gallons of toxic chemicals, and tons of air pollutants into more relevant factors including climate change, health hazards, ozone depletion, ecotoxicity, and others. LCA allows environmental decisions to be made considering the full life-cycle.
Green Engineering requires System’s Thinking which includes all phases of the life cycle of a product, process, or system. Watch this video from TedEd on the life cycle of a t-shirt. As you watch, draw a simple diagram which includes the inputs and outputs to the processes that go into the creation of a simple, plain cotton t-shirt. A complete MFA would include quantitative values for all of the inputs and outputs to this system. An LCA would build upon this data to include quantitative estimates of the environmental impacts that result from these inputs and outputs. After considering the video and it’s MFA, do you take away something you could do to reduce the materials, water, and energy footprints of your own t-shirts?
Now consider the MFA for a processed food product (e.g., Big Mac) and an electronic product like your cell phone. Think about where the products come from, what’s needed during production and during the use-phase, as well as at the end of the life of the product. What’s similar and different about these MFAs?
2.5 Food-Energy-Water Systems
An important concept to mention in this introduction given its importance throughout this course is the Food-Energy-Water (FEW) nexus. These interconnected systems are an emerging area for systems thinking and research. Each of these independently-complex topics are discussed separately in this course in later modules, but their interconnections and tradeoffs are critical to understand and consider. These systems depend critically on the other and, as mentioned earlier for the automobile example, focusing too much on one area may jeopardize the larger system performance due to tradeoffs and unintended consequences. A number of FEW connections are shown graphically in Figure 2.4.
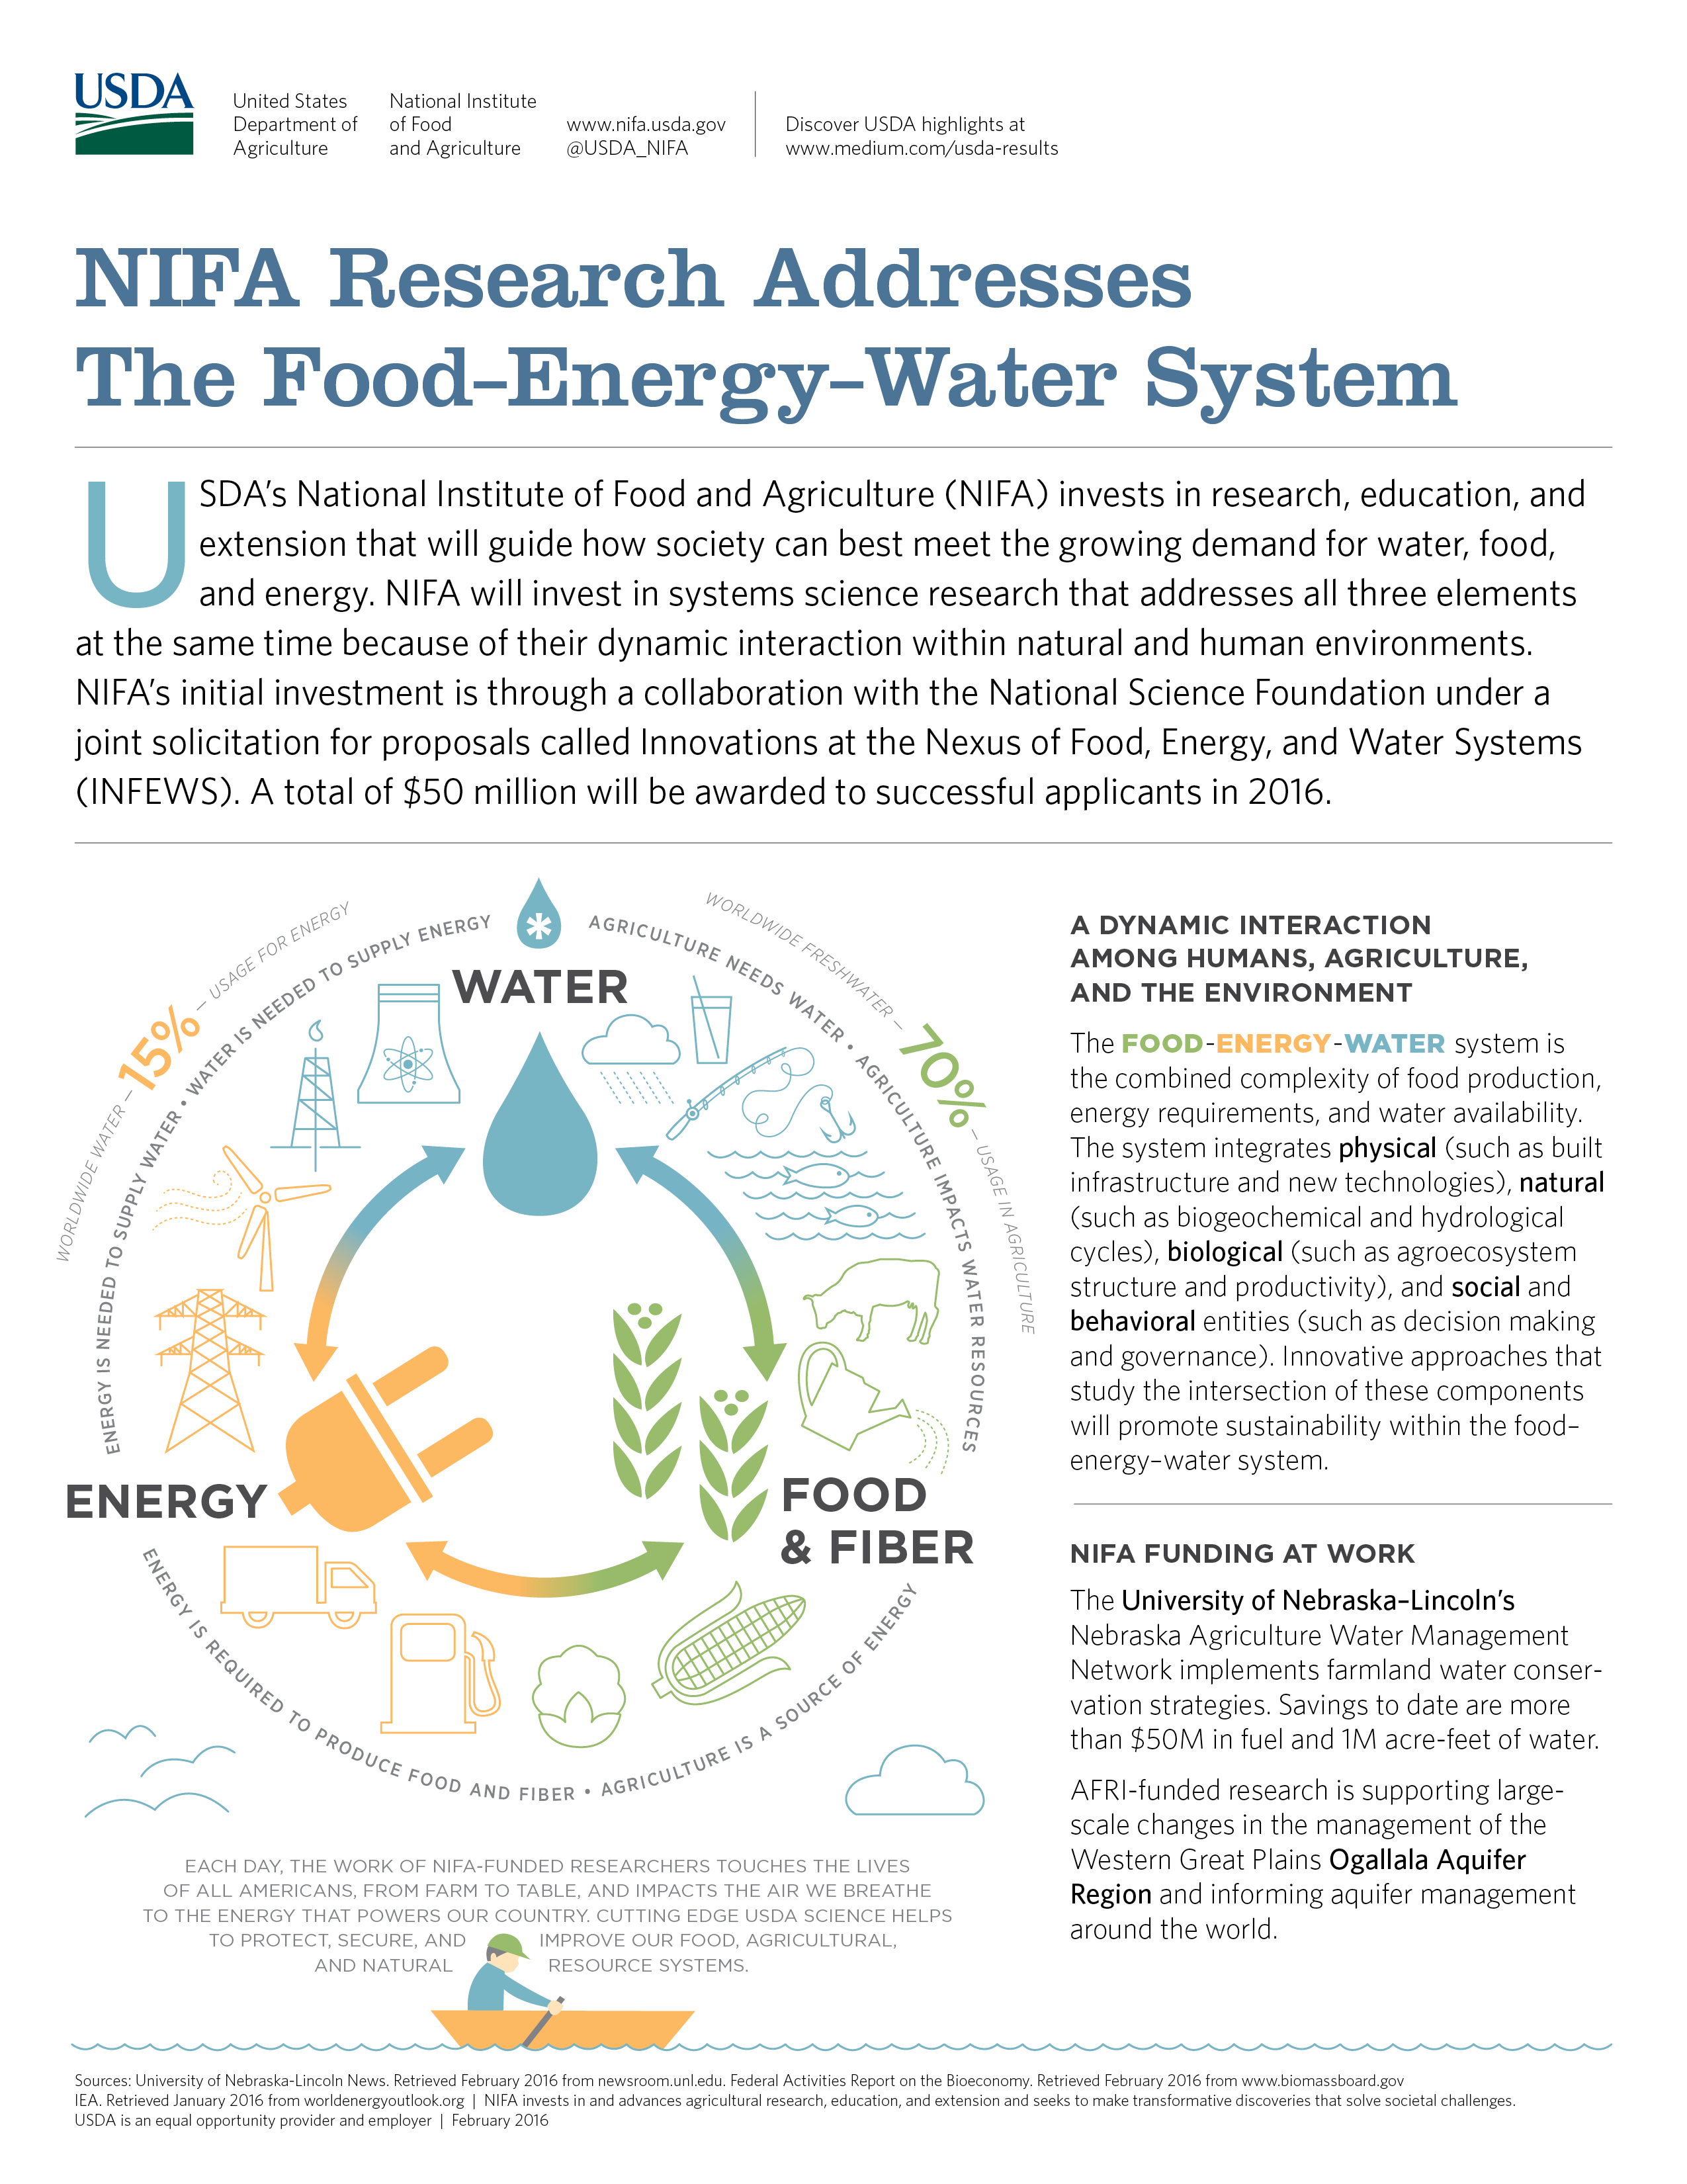
Figure 2.4: FEWS (Food-Energy-Water Nexus) recognizes the systems perspective required to feed our growing planet and provide enough water and satisfy energy demands simultaneously. Image credit: “NIFA Research Addresses The Food–Energy–Water System” by USDA National Institute of Food and Agriculture is licensed under CC BY 2.0.
For example, water is a well-known input for irrigation of food systems but often overlooked as a critical input for cooling of utility scale power plants. Without cooling, the thermodynamic requirements of energy generation cannot be satisfied and these systems must be shut down. This is especially true for nuclear systems where the cooling is part of the safety mechanisms. In recent years, French nuclear power plants have had to limit energy production over the last decade as river temperatures increase and river flows decrease see link here.
Biofuels, another topic that we will discuss later, are often considered as environmentally-conscious fuels compared to fossil fuels like gasoline and diesel. However, they are often derived from food crops like corn or soybeans which can disrupt the food system and cause increased food prices. Biofuels may also be water- and energy-intensive to produce and are heavily dependent pesticides and/or fertilizers for crop growth which can lead to environmental issues like topsoil degradation and ecosystem damage.
2.6 Ecosystems, Natural Capital and Ecosystem Services
Emma Marris is an author living in Bend, Oregon. In her bio, she states “My goal is to find and tell stories that help us understand the past; take meaningful action in the present; and move towards a greener, wilder, happier and more equal future”. In her recent Ted Talk, she describes her definition of nature:
“We evolved on this planet in the context of all the other animals with which we share a planet, and all the other plants, and all the other microbes. And so I think that nature is not that which is untouched by humanity, man or woman. I think that nature is anywhere where life thrives, anywhere where there are multiple species together, anywhere that’s green and blue and thriving and filled with life and growing. And under that definition, things look a little bit different.”
Emma Marris, Nature is Everywhere TedTalk (first 6:14).
As you watch the video (first 6:14), consider the following:
- What places can you think of that look untouched, but really are not? How are they touched by us?
- Are we part of nature?
- Can you identify a place with multiple species that looks on the surface devoid of life, unnatural, with our fingerprints all over it?
- Is there a heavy human fingerprint on natural parks?
- What is her argument that nature is not over?
After watching this video, we’d like you to get outside and take your own picture of nature. Write a short paragraph caption for this picture that describes why this example speaks to you and what makes it “nature” from your perspective. See here to submit this exercise within Canvas.
While this course is focused on engineering, it is critical to have a basic understanding of the role of ecosystems in our daily lives so that our engineering choices do not compromise ecosystem services that improve our lives now and future generations.
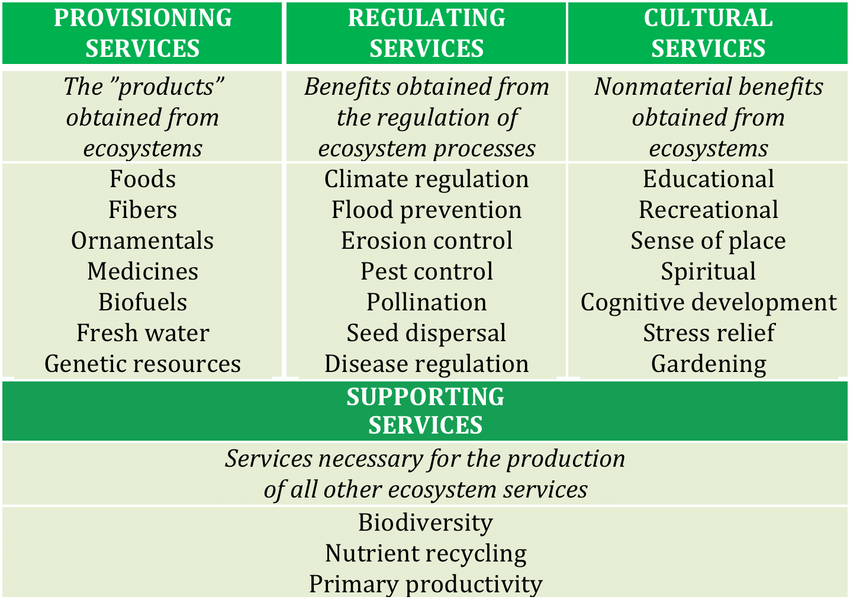
Figure 2.5: Ecosystem services include provisioning services, regulating services, cultural services and supporting services (Source: Millenium Ecosystem Assesment. Ecosystems Human Well-Being: Synthesis; Island Press: Washington, DC, USA, 2005). Image credit: From Colding and Role (2017), under CC BY 4.0.
An ecosystem includes all the living things including plants, animals, humans, and microorganisms in a specific geographic area that interact with each other, and with abiotic factors including weather, minerals, sunlight, soil, climate, atmosphere, etc. link to definition. Each organism in an ecosystem fills a specific niche and is interconnected in complex ways which are often not obvious or even fully understood.
Over this past summer, how have you benefited from ecosystem services? Spend 5-minutes reflecting on your summer. Based on your experiences, describe 2 ecosystem services that you received. Consider how these improved your own human well being, and what replacements you have if these services were no longer available.
Most people, including engineers, think of ecosystems primarily from a raw materials perspective (plants, animals, soil, minerals, water) without considering the critical services that they also provide for the planet which allow for humans to survive and thrive. Natural Capital is a term for raw materials provided by the Earth. The Natural Capital Coalition defines this as “the stock of renewable and non-renewable resources (e.g. plants, animals, air, water, soils, minerals) that combine to yield a flow of benefits to people.” Much of the earth’s natural capital is finite meaning that society can run out of these resources like fossil fuels, metals, and ceramics. Other natural capital like wood and fresh water is renewable if the withdrawal rate from nature is less than the regeneration rate.
Natural capital also includes the services that ecosystems provide for humans. Most people don’t understand how ecosystems work and therefore don’t understand their natural processes provide services for our societies that we don’t have to do ourselves. Ecosystem services include water purification and filtration provided by soils and wetlands, the production of oxygen from photosynthesis, the flood reduction provided by wetlands and mangroves. These are just of few of the many services (or Nature’s gifts) provided to us by ecosystems. These services are happening in the background all the time, are not easy to see, and therefore can easily be taken for granted. These services are typically categorized as provisioning, regulating, cultural, and support as shown in Figure 2.5 (Colding and Barthel (2017)).
While you’ve read about ecosystem services, take a moment to make the definitions resonate with you. Think of a specific example for each type of Ecosystem Service : supporting, regulating, provisioning, and cultural ecosystem services. For each example, think of how you would answer the following questions:
-
Define the ecosystem services type (provisioning, regulating, cultural, supporting)
-
Describe example
-
Describe impact to human well-being and our prosperity
-
If this particular ecosystem service is not valued, who will be most impacted and why?
While we typically put value on the Natural Capital components that are raw materials (wood, minerals, fuels, etc.) because they are sold in the economic market, ecosystem services are often not valued explicitly in our economic systems. That is, we take these services for granted and do not consider the economic costs of their degradation. For example, if we cut down forests, we obtain the value for the raw timber but do not economically account for the loss of the ecosytem which produces oxygen, provides species habitats, filters water, and more. These ecosystem services have significant monetary value to society which we typically see only when ecosystems breakdown and we have to manage these services on our own. Costanza et al. (2017) published an early critical paper on this topic in 1997 to try to estimate the values of natural capital and ecosystem services. Their premise was that the value of ecosystem services should be explicit in our economic frameworks. Quantifying these economic values is very difficult to do accurately, and some critics argued that it couldn’t be done, but these researchers argued that it was important to have at least an order of magnitude estimate to consider these values in decision-making because they are part of Earth’s life-support system and represent part of the total economic value of the planet.
This research has continued over the years and now estimates the current economic value of 17 ecosystem services for 16 biomes. For the entire biosphere, the value is in the range of US $16-54 trillion per year which is considered a minimum value given the accuracy of the estimates. For context, the total global gross national product total is approximately US $18 trillion per year.
2.7 Industrial Symbiosis
Given the evolutionary success of ecosystems at providing the needs for all of its members to survice, one can use this as a model for designing industrial systems. This is known as Industrial Symbiosis where the waste products for one industry are used as inputs for another industry in a circular economy framework. One can consider implementing this over any scale or geography, but co-locating a number of complementary industries is most effective. The best working example of this is the city of Kalunborg, Denmark, which has developed an eco-industrial park since the early 1970s link to website. The focus of this exchange network is the Asnæs Power Station, a 1500MW coal-fired power plant. It supplies surplus heat to 3500 local homes and a nearby fish farm. The fish farm produces sludge which is sold as a fertilizer. Waste steam from the power plant is also sold to a pharmaceutical/enzyme manufacturer and an oil refinery. This reuse of heat reduces the amount thermal pollution discharged to a nearby fjord. Sulfur dioxide from the power plant’s scrubber also contains gypsum which is sold to a wallboard manufacturer reducing mining of this mineral. A number of additional energy and materials flow have been added over the years and are shown below in Figure 2.6.
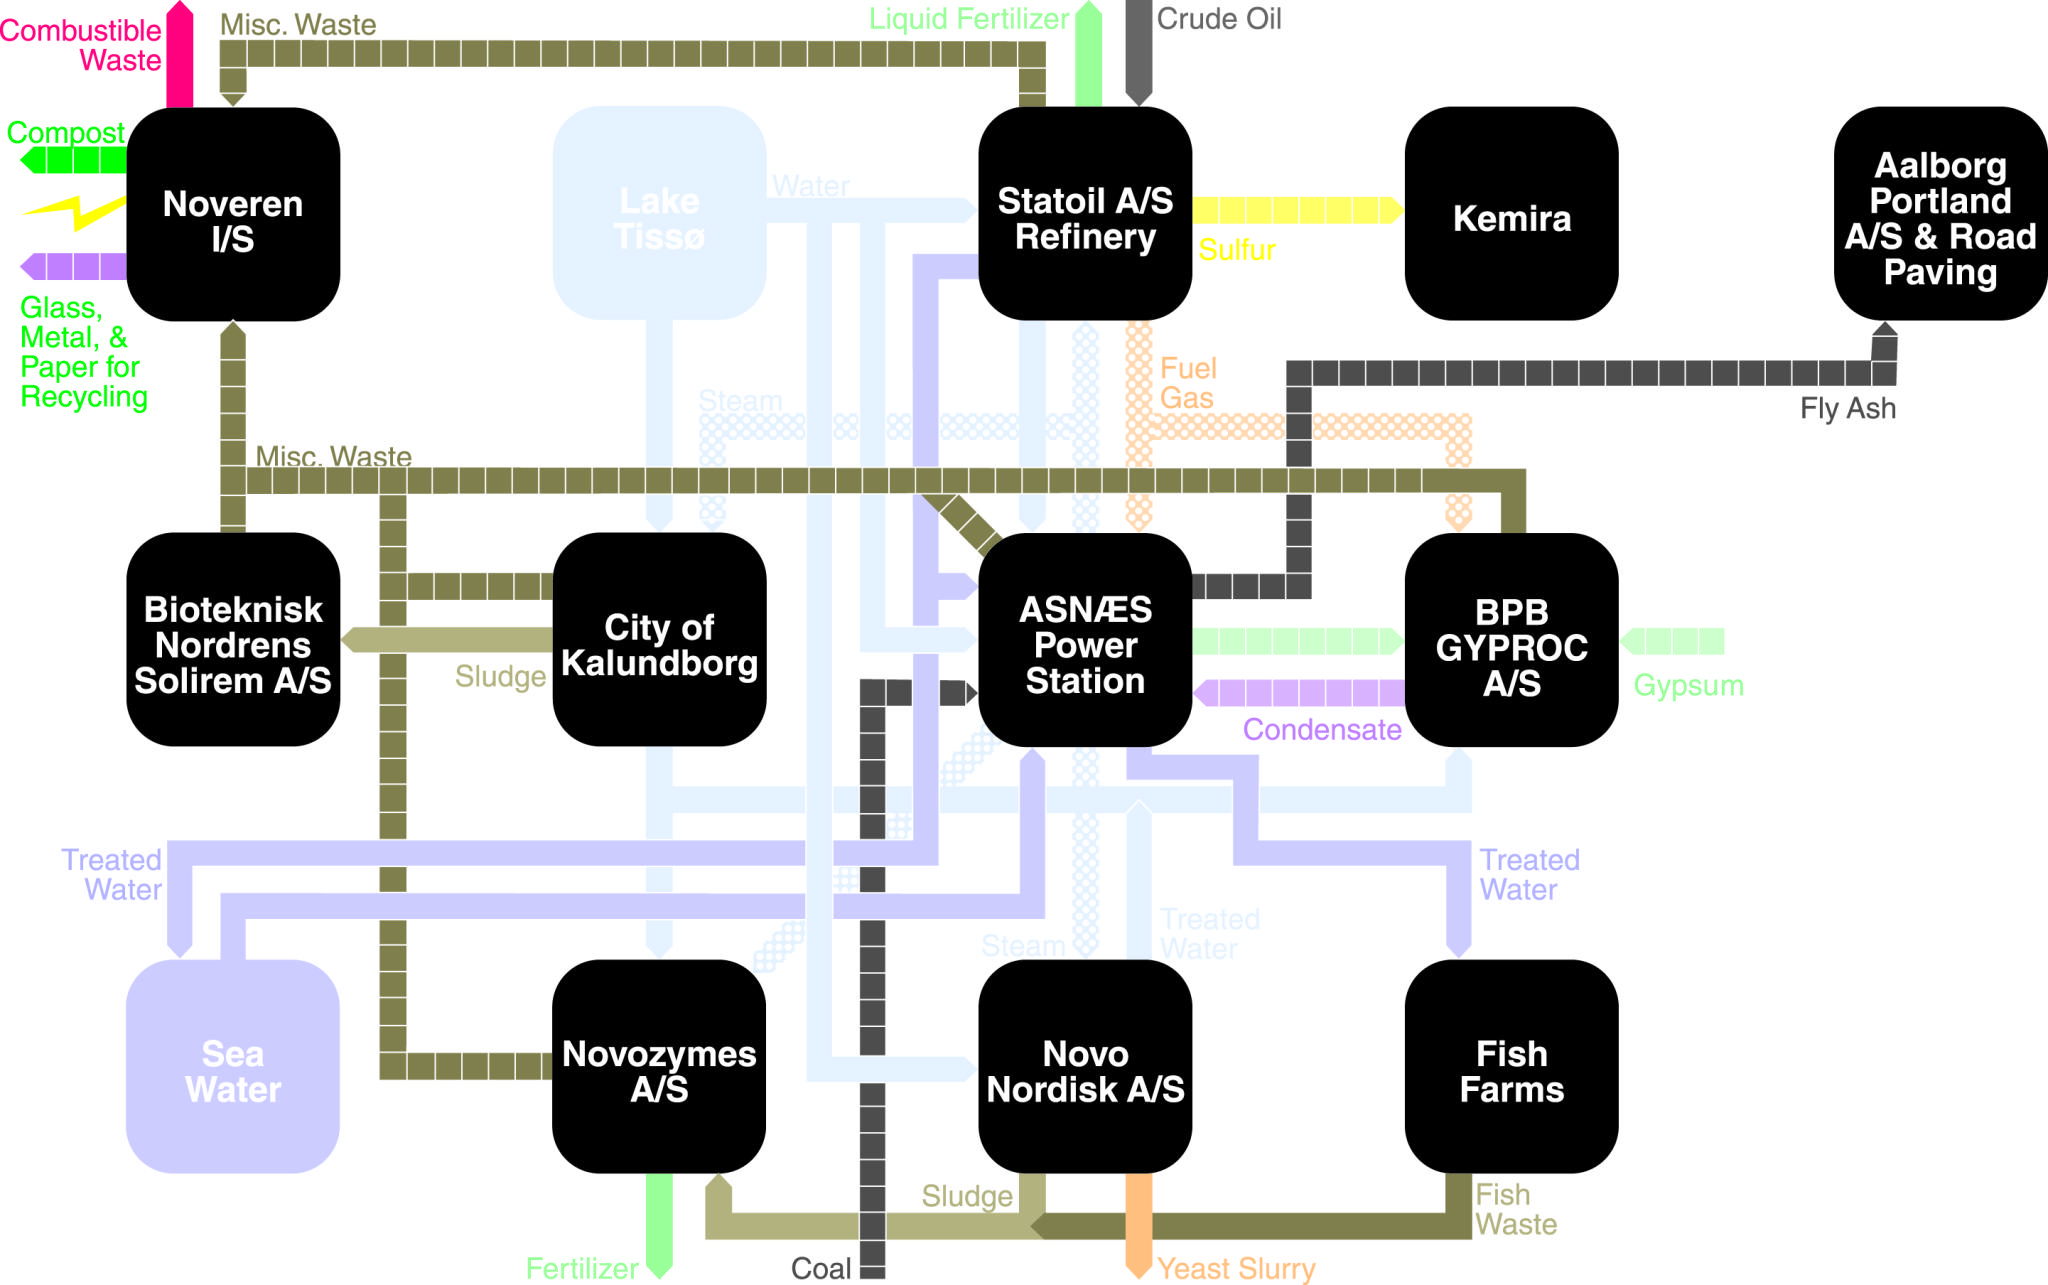
Figure 2.6: The Kalundborg Industrial Estate coordinates inputs and outputs from many area organizations in order to use energy, materials, and waste efficiently. Image credit: Shedroff, Nathan. 2009. Design is the Problem: The Future of Design Must be Sustainable. New York: Rosenfeld Media. Source: https://commons.wikimedia.org/wiki/File:Kalundborg_industrial_symbiosis_diagram.jpg, under CC BY XX
. Image credit: From Greenfield Global, under CC BY-NC-SA 2.0.](images/01_intro/IndSymb.jpg)
Figure 2.7: Industrial symbiosis in action. The view from above the Greenfield Global ethanol plant in Chatham, Ontario. The plant takes corn in and uses it to produce a host of products and wastes. Truly Green Farms has built 45 acres of greenhouse (in the background behind the stack) that is heated by waste heat from the stack at the plant. See story, video and CKUA podcast. Image credit: From Greenfield Global, under CC BY-NC-SA 2.0.