5 Energy Systems

5.1 Background
In this chapter, we’ll introduce the basics behind energy used in our daily lives and discuss the energy transformations underway and expected for the next decade. We will dive into basic energy calculations, provide a context for energy units and values (how much electrical energy does is required for a house in the US per year), and consider the triple bottom line applied to traditional fossil-fuel derived power plants. The next chapter will continue this discuss for renewable and more sustainable energy systems.
Learning Objectives
- List the primary Non-Renewable Energy Sources
- Explain the systems that generate and distribute electricity from fossil
- Understand and apply units and conversion factors for Energy and Power
- Apply Power Plant Energy, Capacity Factor and Efficiency equations to estimate energy metrics of interest
- Define Energy Return on Investment (EROI)
- Explain the primary Triple Bottom Line Impacts of Non-renewable Energy
Key Questions
- What are the common energy and power units? How are conversions done between units?
- What is the difference between primary and secondary energy and why is this distinction important?
- What is the difference between the Capacity Factor and the Efficiency for a power plant?
- What is Energy Return on Investment (EROI) and why is it important?
- Explain several specific Triple Bottom Line trade-offs for each of the main non-renewable energy sources.
- What is the difference between Sustainable and Renewable Energy Systems?
5.1.1 Resources
University of Michigan Factsheets - an online source that’s updated yearly for sustainabilty referenced information. Within energy, there site contains information on Biofuels, Geothermal, Nuclear, Solar, Wind, General renewables, and Grid Energy storage, and unconventional fossil fuels (largely natural gas). CSS03-11 is a great resource for the US Energy Factsheet.
5.1.2 Primer: Definitions
Capacity = maximum power output; you’ll also come across the term name-plate capacity, frequently in units of MW.
Capacity factor = ratio of the energy produced over a given time (most frequently a year) over the amount of energy that could have been produced if plant running 100% of given time.
Energy = the capacity to do work (mechanical, chemical, electrical, …) or to transfer heat between objects at different temperatures, frequently in units of kWh, Joules, or BTUs.
Power = the time rate of energy, frequently in units of W or J/s.
Resource base = the total amount of a particular resource that is available on the earth. For materials that do not grow or regenerate, like all metals and ceramics, this amount is fixed.
Reserves = the fraction of the Resource base that can be extracted with reasonable certainty under existing technical conditions and economics using current technology. Reserves of fossil fuels are generally depleted over time as society uses these resources for energy. Reserves can increase due to discoveries of new geological supplies for these materials, technological advances that make previously unreachable or overly expensive resources unavailable, or economic and political changes.
Depletion Time, t = for any material, the amount of time before a resource is depleted. This is estimated by the Reserves (tons) divided by the societal use rate (tons/yr).
5.2 What are Energy and Power?
Energy is all around us and integrated into our lives. In many ways, we take energy for granted and don’t understand the complex systems behind our energy systems. When we turn on the light switch, we just expect the light to turn on and don’t consider what is required for this to work so reliably.
Energy and power are often used interchangeably by the public, but they have very specific scientific definitions that are critical to understand and apply correctly for energy calculations and analysis. Confusion between energy and power is common for students and leads to many energy calculation errors.
Energy is defined as the capacity to do work or to transfer heat between objects at different temperatures. Power is the rate at which work is done. Mathematically, energy is the power (P) multiplied by amount of time (t) as shown equation (5.1). For electricity, the power is typically given in units kilowatts (kW) while the energy is given in units of kilowatt-hours (kWh). This is consistent with the equations above. Keeping track of the units and checking them carefully can often confirm that you have applied the energy equations properly.
\[\begin{equation} E=\int_{}^{}P dt=P\times t\left( \text{for constant power draw} \right) \tag{5.1} \end{equation}\]
For a power plant, the power is an instantaneous measurement while the energy is the power delivered over time as shown mathematically by the integral function in equation (5.1). For energy calculations, we often assume that the power is a constant meaning that a power plant is running in a steady state mode which is desirable and common for a large steam power plant over many hours. This assumption allows the integral to be simplified in the equation. We will see in the next chapter that some renewable energy systems like solar and wind do not run at a constant power so the energy calculation becomes more complex by integrating the variable power over time.
Energy comes in many different forms and there are different ways to categorize this energy depending on your perspective. Some typical categories of energy that you have likely heard about in your past academic experiences are listed below:
- Mechanical energy
- Potential energy (e.g. wind-up spring, gravitational such as water in reservoir)
- Kinetic energy (e.g. spinning flywheel, moving automobile)
- Thermal energy (e.g. heat in passive wall, solar-heated pellets, boiling water)
- Chemical energy (e.g. fossil fuels, biomass, batteries)
- Electromagnetic energy (e.g. electricity, solar radiation)
- Nuclear energy (e.g. fission of uranium, fusion of H into He)
Energy is measured in a variety of units. The box below shows many of the common energy units for fossil fuels as well as the conversions between them. In later chapters, we will add conversions for alternative energy sources. Some of these units are more famililar to us than others since they are often specific to certain disciplines and applications. Electricity, as mentioned previously, is almost always reported in kilowatt hours (kWh) and not therms or British Thermal Units (BTUs) which are commonly used for heat as we will see in later chapters on buildings. It is not incorrect to report electricity in therms, but you will rarely see this used in industry. Units conversions are important since they are frequently necessary when an analysis dictates energy units different than the reported data or when you need to compare or sum up different types of energy – like annual campus energy use for electricity, heating, and commuting by car.
Basic Units for Energy and Power for Electricity
Energy Units (Energy = Power x Time)
| Unit 1 | Unit 2 |
|---|---|
| energy | energy |
| 1.0 joule (J) | one Newton applied over a distance of one meter (= 1 kg m2 s-2) |
| 1.0 joule (J) | 0.239 calories (cal) |
| 1.0 calorie | 4.184 J |
| 1.0 kilowatt-hour (kWh) | 3.6 MJ |
| 1.0 kilowatt-hour (kWh) | 3413 BTU |
| 1.0 gigajoule (GJ) | 0.948 million BTU |
| 1.0 gigajoule (GJ) | 278 kWh |
| 1.0 British thermal unit (BTU) | 1.055 kJ |
| 1.0 Quad | One quadrillion BTU |
Power Units (Power = Rate of energy use = Energy/time)
| Unit 1 | Unit 2 |
|---|---|
| power | power |
| 1 watt (W) | 1.0 joule per second |
| 1 watt | 3.413 BTU per hour |
| 1 kilowatt (kW) | 3413 BTU per hour |
| 1 kilowatt (kW) | 1.341 horsepower |
| 1 horsepower (hp) | 550 foot-pounds per second |
| 1 horsepower (hp) | 2545 BTU per hour |
| 1 horsepower (hp) | 745.7 W |
Notes: Energy content is usually expressed as Lower Heating Value (LHV), which is closest to the actual energy you get in most cases. The Higher Heating Value (HHV) is about 5% higher for coal and up to 10% higher for natural gas because it includes extra energy from condensing combustion products. For most biomass, the difference between LHV and HHV is about 6-7%. Whether you use LHV or HHV depends on the situation. For example, HHV is better for power plants where exhaust gases are cooled and reused, while LHV is better for things like cars where exhaust gases aren’t reused. Typically, European sources report LHV, while North American sources use HHV.
One of the challenges when we think about energy relates to the units. For example, how much energy is in a gallon of gas or a metric ton of coal? Here’s a short example that answers the question: How much space does a metric ton of coal represent?
mass = 1000 #kg or 2,200 lbs
Density_coal = 1346 #kg/m³

Volume =  mass/Density_coal*3.2808^3 # where 3.28 ft in 1 m
length = Volume^(1/3);
Based on the calculation above, the volume of 1 metric ton of coal is 26.2 ft3, or one side of the cube is 3 ft. Note we used a unit conversion given that the coal density was in kg meter-3.
Basic Units for Energy of fossil fuels
Barrel of oil equivalent (BOE)
| Unit 1 | Unit 2 |
|---|---|
| 1.0 BOE | 6.1 GJ |
| 1.0 BOE | 5.8 million BTU |
| 1.0 BOE | 1,700 kWh |
| 7.2 BOE | 1 metric tonne of oil |
Petroleum Barrel
| Unit 1 | Unit 2 |
|---|---|
| 1.0 Petro barrel | 42 gallons |
| 1.0 BOE | 5.8 million BTU |
| 1.0 BOE | 1,700 kWh |
Petro-Diesel
| Unit 1 | Unit 2 |
|---|---|
| 1.0 gallon | 130,500 BTU |
| 1.0 gallon | 36.4 MJ/L |
| diesel density | 0.84 g/ml |
Gasoline
| Unit 1 | Unit 2 |
|---|---|
| 1.0 gallon | 115,000 BTU |
| 1.0 gallon | 121 MJ |
| 1.0 gallon | 32 MJ/L (LHV) |
| HHV | 125,000 BTU/gallon |
| HHV | 132 MJ/gallon |
| HHV | 35 MJ/liter |
| 1 metric tonne gasoline | 8.53 barrels |
| 1 metric tonne gasoline | 1356 liters |
| 1 metric tonne gasoline | 43.5 GJ/t (LHV) |
| 1 metric tonne gasoline | 47.3 GJ/t (HHV) |
| gasoline density | 0.73 g/ml |
Note that the energy content (heating value) of petroleum products per unit mass is fairly constant, but their density differs significantly – hence the energy content of a liter, gallon, etc. varies between gasoline, diesel, kerosene.
Coal
| Unit 1 | Unit 2 |
|---|---|
| 1.0 metric tonne | 27-30 GJ (bituminous/anthracite) |
| 1.0 metric tonne | 15-19 GJ (lignite/sub-bituminous) |
Note that the energy content (heating value) per unit mass varies greatly between different “ranks” of coal. “Typical” coal (rank not specified) usually means bituminous coal, the most common fuel for power plants (27 GJ/t).
Natural gas
| Unit 1 | Unit 2 |
|---|---|
| HHV | 1027 Btu ft-3 |
| HHV | 38.3 MJ m-3 |
| LHV | 930 Btu ft-3 |
| LHV | 34.6 MJ m-3 |
| 1 Therm | 100,000 Btu |
| 1 Therm | 105.5 MJ |
| 1 Quad | 1 quadrillion BTU or 1015 BTU |
Unit conversions are a critical engineering skill. Data found in literature may have different units than needed for a particular calculation or report. European and US industries also have different standards for units. Stories abound in industry of projects that were affected significantly by mistakes with unit conversions. In one famous example, NASA lost a space satellite, the Mars Climate Orbiter, to improper conversion to metric units.
There are several different techniques to do unit conversions. You should use the technique that makes sense and works best for you. The examples in this chapter show a few of these methods. It is best practice to include all units in engineering calculations and to cancel them out so that you are left with the units you desire. Unit conversions are not difficult, but they do require consistency and focus.
A campus uses 10 million BTU of heating energy in the winter. How many MWh of energy is this?
Using the tables provided in this chapter or online resources, figure out which unit conversions you’ll need. Then work through the example and cancel out your units explicitly as you work through the problem. As engineers and scientists, we always want to show our work with units so we don’t make a simple unit conversion mistake. This process also allows others to more easily check your work. The solution is shown below..
Solution:
First, obtain the conversion factor from kWh to BTU:
\[\begin{equation} 1\text{ kWh}=3412\text{ BTU } \end{equation}\]
Second, incorporate the conversion from kWh to MWh. At this step, the units kWh cancel out since they are found in the numerator and denominator of the equation:
\[\begin{equation} \frac{1\text{ kWh}}{3412\text{ BTU}}\times \frac{1\text{MWh}}{\text{1,000 kWh}} \end{equation}\]
Third, you can now use this conversion along with the given amount of winter heating energy to calculate the amount of MWh:
\[\begin{equation} \left(10\times 10^{6}\text{BTU} \right)\times \frac{1\text{ kWh}}{3412\text{ BTU}}\times \frac{1\text{MWh}}{\text{1,000 kWh}}=\bbox[yellow]{\text{2.93 MWh}} \end{equation}\]
In practice, we generally show the complete final equation. When doing any calculation, showing the unit conversions provides an opportunity to check your work. Units that show up in the numerator and denominator can be cancelled out to obtain the remaining units from the numerator and denominator. In this problem, BTU and kWh cancel out, and the remaining unit is MWh.
5.3 Energy Sources - Fossil Fuels
Fossil fuels are the predominant energy source around the world and have been for the past century. The primary fossil fuels are coal, natural gas, and oil. These are often called “conventional” fossil fuels. These energy sources originated from fossilized plants and animals from approximately 100 million years ago. These energy sources are not considered renewable given the amount of time required for them to form again compared to human time scales. The biggest advantages of these natural sources of energy are their high energy density which is given by the amount of energy divided by the mass or volume of the material. A high energy density indicates a high energy for a small mass or volume which is preferable for storage and transportation of the fuel. The equations for mass density and volumetric density are given in equations (5.2) and (5.3).
\[\begin{equation} \rho_{\text{e,mass}}=\frac{\text{fuel energy}}{\text{fuel mass}} \tag{5.2} \end{equation}\]
\[\begin{equation} \rho_{\text{e,volume}}=\frac{\text{fuel energy}}{\text{fuel volume}} \tag{5.3} \end{equation}\]
Show that the Higher Heating Value (HHV) values in the previous table for natural gas are equivalent using unit conversion. Remember, HHV is the energy value released during combustion per volume or mass of the substance. Here, you’ll need to use the density of the fuel and the conversion factor between MJ and BTUs.
Solution:
First, obtain the conversion factor from therm to BTU and therm to MJ contained in the table:
\[\begin{equation} \frac{\text{1 Therm}}{100,000\text{ BTU}}\times \frac{105.5\text{ MJ}}{\text{1 Therm}} \end{equation}\]
Second, obtain the volumetric energy density of natural gas : 1,027 BTU/ft3
Third, perform dimensional analysis. In the equation below, our desired units are MJ/m3 thus we’ll need to incorporate the conversion between feet and meter. Note: to cancel out the length units, the conversion factor between ft and m was cubed:
\[\begin{equation} \frac{105.5\text{ MJ}}{\text{100,000 BTU}}\times \frac{1,027\text{ BTU}}{\text{ft}^{3}}\times \left( \frac{\text{3.048 ft}}{m} \right)^{3}=\bbox[yellow]{38.3\frac{MJ}{m^{3}}} \end{equation}\]
Coal is classified into four main types, or ranks: anthracite, bituminous, subbituminous, and lignite. The ranking depends on the structure and amount of carbon the coal contains, which in turn, determines the amount of heat energy in the coal. The rank of a coal deposit is determined by the amount of pressure and heat that acted on the plants over time. Since these coal ranks depend on different geological histories, they are found in different parts of the US and world. For example, anthracite mines in the US are in Pennsylvania while bituminous coal, the most abundant rank of coal found in the United States, is mined in West Virginia and other states. Sub-bituminous coal is primarily produced in Wyoming and is often used in coal-fired power plants due to its low sulfur content making it easier to meet US environmental regulations. Peat is a softer and crumbly substance formed in the first step in the formation of coal and has much lower energy density or heat content. Table X shows the range of carbon content and heat content for these types of coal.
| Coal | Carbon content (%) | Heat Content (MJ/kg) |
|---|---|---|
| Anthracite | 86 - 97 | 32 - 33 |
| Bituminous coal | 45 - 86 | 23 - 33 |
| Sub-Bituminous coal | 35 - 45 | 18 - 23 |
| Lignite | 25 - 35 | 17 - 18 |
| Peat | < 25%* | 15* |
- Peat is less well-defined than other types Sources: EIA and Energy Education
Coal energy density is often given in MJ/kg or MJ/ton whereas a biomass like corn may be given in MJ/bushel since bushels are a more common measurement unit for this food product. Conversion of MJ to kWh for energy or tons to cubic meters are perfectly valid if different units are required. Note that these equations are easily rearranged so that Fuel Energy (MJ) = Fuel Mass (kg) * Energy density (MJ/kg).
Natural gas is a hydrocarbon mixture consisting of 70 – 90% methane, chemical formula CH4, with smaller amounts of natural gas liquids (NGLs) and nonhydrocarbon gases, such as carbon dioxide and water vapor. In some geographic locations, natural gas has diffused to large cracks or spaces between overlying layer of rock. This type of natural gas is often called conventional natural gas and it’s easier to extract since a relatively large amount of gas is found in relatively unconstrained spaces. Much of this type of natural gas has already been mined around the world since it’s cheaper and provides more profit to energy mining companies. In other places, natural gas occurs in the tiny pores (spaces) within shale, sandstone, and other types of sedimentary rock. This natural gas is referred to as shale gas, tight gas, or “unconventional” natural gas. This gas is much more difficult to extract since the pores in the rock deposits must be physically fractured with high pressure water, chemicals, and small sand or ceramic particles to release and collect the gas. Significant technology advances by the mining industry in hydraulic fracturing made this type of mining economical starting around 2000.
Natural gas also occurs along with deposits of crude oil. This natural gas is called “associated” natural gas and is often burned off (flared) from oil wells as you might have seen in images for safety and economic reasons. Natural gas found in coal deposits, called coalbed methane, is also a hazard to coal miners as the gas can collect and explode under some conditions. The old phrase “canary in the coal mine” refers to the mining practice of keeping live canaries in cages in coal mines as early detectors of problems. The birds were much more sensitive to the build up of methane and carbon monoxide which could kill miners so they acted very effectively as an early warning system.
Crude oil, also commonly called petroleum, is the fossil fuel liquid that is pumped from underground geological deposits around the world and then refined into more useful chemicals. The first commercial oil wells were developed in Pennsylvania starting around 1860 when oil was discovered very close to the surface. Like the other fossil fuels, over time the easy and economical oil deposits have been depleted. Oil companies now extract oil from depths of a mile or more beneath the surface of the ocean and earth’s surface.
Chemically, crude oil is a mixture of hundreds of different hydrocarbons. This liquid is chemically transformed into several different petroleum products including gasoline, diesel fuel, pitch, and tar. A standard 42-gallon barrel of oil is refined into approximately 45 gallons of petroleum products distributed as shown in Figure 5.1.
Petroleum Products Produced From a Barrel of Crude Oil - https://www.eia.gov/energyexplained/oil-and-petroleum-products

Figure 5.1: Petroleum Products produced From a Barrel of Crude Oil.
Tar sands, also known as oil sands, hold oil in the form of a mixture of bitumen - a thick, sticky, black oil that forms when lighter oil is degraded by bacteria. This bitumen is mixed with sand, clay, and water and must be separated to produce a crude oil that can be further refined as typical crude oil. The tar sands mixture is much thicker than conventional oil so it does not flow easily and it cannot be pumped like conventional oil. It is mined by Open-pit mining when found near the surface, as is the case for the large deposits found in Alberta, Canada. When tar sands are too deep to easily mine, the bitumen can be extracted by in-situ mining in which hot steam or solvents are injected to loosen up the bitumen and allow it to flow through a well to the surface.
The concepts of resource reserves and depletion times for fossil fuels is important to mention as it comes up in the news and leads to many debates. The depletion time is estimated by dividing the resource usage rate by the amount of reserves as in the equation below:
\[\begin{equation} \text{Depletion Time}\left[ \text{yrs} \right]=\frac{{\text{Reserves}\left[ \text{tons} \right]}}{\text{Usage}\left[ \frac{\text{tons}}{\text{yr}} \right]} \end{equation}\]
This equation provides only an estimate for planning purposes, not an exact number, since both the Reserves and Use Rate change with time. Using current reserves and usage gives a useful estimate but doesn’t account for potential changes to both of these going forward. Moreover, both of these terms are difficult to measure accurately adding to the uncertainty in the calculation. Finally, most resources are never fully depleted due to economic factors. As supply decreases, prices generally increase which means that eventually different options will be developed before the complete depletion of any resource. History provides some interesting context. While we are concerned today with the depletion of oil, it was the discovery and implementation of oil in the late 1800s which likely saved the extinction of certain whale species which were the primary sources for oil for lighting lamps at that time.
Global proved oil reserves are estimated at approximately 1.7 trillion barrels. At the current rate of use of almost 100 million barrels per day, oil reserves are projected to last about 50 years.
Natural gas reserves total 7.3 trillion ft3 with an estimate of approximately 100 years at current consumption rates. These reserves have increased significantly in recent years with the advent of hydraulic fracturing, or fracking, which has opened up natural gas resources in the US that were previously too difficult and costly to recover.
Coal reserves 1.1 trillion tons, an amount expected to last approximately 130 years under current projections, though coal US in the United States is trending down with increased use of natural gas and renewables due to economic and environmental benefits. https://www.statista.com/statistics/243934/coal-consumption-in-the-united-states/
Tar sands, shale gas, and other unconventional fossil sources have less well-defined reserves so depletion times are difficult to state with much certainty.
5.4 Energy Sources - Nuclear Energy
Nuclear energy uses the fission of atoms rather than the combustion of chemical fuels to produce energy. Traditionally, uranium atoms are split by neutrons in a controlled chain-reaction fission process. The splitting of the uranium produces lighter radioactive elements, additional neutrons to continue the process, and large amounts of heat. The heat produces steam which is then used by a turbine generator to generate electricity in a very similar way to steam power plants that combust coal, oil, or natural gas. A big advantage to nuclear power is the energy density of the fuel. One uranium fuel pellet slightly bigger than a cube with 1 cm sides creates as much energy as one ton of coal, 150 gallons of oil or 17,000 cubic feet of natural gas. https://www.nei.org/fundamentals/nuclear-fuel
Due to the radioactive nature or the uranium fuel and fission reaction waste products, these power plants are much more sophisticated than a standard steam power plant in order to control the nuclear reactions and contain the hazardous radioactive materials. The details of nuclear power plant design are beyond the scope of this text, but research continues on safer and more cost-effective nuclear power technologies.
5.5 Energy Sources – Triple Bottom Line
TBL issues for fossil fuels and nuclear energy have been hinted to in the above discussion. We will briefly highlight some of the TBL issues here, but will discuss this in further chapters and encourage you to do additional research. First, though, we should distinguish between sustainable and renewable resources. The energy sources discussed so far are non-renewable because their physical amounts are limited on earth – there is only a finite amount of coal, oil, natural gas, and radioactive materials available. Once this material is extracted and used to generate energy, it is gone forever (though the mass is conserved as pollution). Renewable energy sources like solar, wind, wave and geothermal energy discussed in the next chapter are available over much, much longer periods of time and essentially cannot be depleted. Whether an energy source is sustainable is a different question that whether it is renewable. Sustainability depends on the time frame, and some finite and renewable energy sources can be considered sustainable if they are used at a rate which is low enough to make them last for very long periods of time. There is no absolute time frame or definition for sustainable fuel sources.
5.5.1 TBL quick review of coal, oil, and natural gas.
Tar sands represent a potentially large reserve of oil, but are associated with significant environmental challenges. Oil production from tar sands disturbs large amounts land and requires significantly more water and energy compared to other oil types. There is also a leftover waste products for this methods which can be risky to nearby water sources.
5.5.2 TBL of nuclear power
Estimates for overall cost for new nuclear plants built are approximately twice that of current solar, wind, and combined cycle natural gas plants. Moreover, construction costs and delays continue to plague recent nuclear power plants with costs typically 2 – 3 times higher than original estimates CSS Nuclear FactSheet https://css.umich.edu/publications/factsheets/energy/nuclear-energy-factsheet).
5.6 Energy Use in the US and World
The previous sections were focused on the sources of energy which dominate energy generation in much of the world. It’s equally important to look at the demand and use of energy to understand where energy and generated electricity are being used.
Figure 5.2 below is a pie chart from the US Energy Information Administration (EIA) which details the primary energy consumption broken out by source in the US in 2021. You can see that fossil fuels comprise almost 80% of energy use even though renewable energy sources have grown significant in recent years. Data charts like this exist for different years and countries so one can compare can contrast geographic trends over time.
Note from the title of this chart that the data is for primary energy. Primary energy is the input energy into a system while secondary energy is the output energy after processing or transformation. Energy is lost when transformed from one form to another so it’s critical to pay attention to these differences for analysis and calculations.

Figure 5.2: US primary energy consumption by energy source for 2021. The piece of the renewable pie continues to grow, whereas coal is declining. Source: Energy Information Administration - https://www.eia.gov/energyexplained/us-energy-facts
A Sankey Diagram is another effective way to show the flow of energy through a system. It provides similar primary source energy data to the pie chart above but also includes additional information such as secondary energy from electricity, the sectors which use the energy, and rejected energy. The rejected energy is primarily energy lost in transformation or use as heat. Figure 5.3 is a Sankey Diagram for US Energy Consumption in 2021. It is noted at the top that the overall annual energy consumption in the US was almost 100 million Quads. A Quad is just another energy unit commonly used in the energy industry which is equal to a quadrillion (1015) BTU of energy. The flow of energy in this diagram is also proportional to the width of the colored and shaded lines from sources to sectors to aid in visual interpretation.

Figure 5.3: US Sankey diagram in total energy (quads) that shows the primary energy by each source and the resulting consumption by sector. Source: https://flowcharts.llnl.gov/
Many useful questions can be asked and answered from the quantitative graphics in a Sankey diagram. For example:
What \(\%\) of the Natural Gas usage was used for Electrical Generation?
The light blue natural gas line heading to the orange electricity Generation box is 12.5. Note at the top that the units are in Quads. Since the total natural gas primary energy is 33.4 Quads, the percentage is:
\[\begin{equation} \text{Percent}=\frac{12.5\text{ quads}}{33.4\text{ quads}}=\bbox[yellow]{37\text{%}} \end{equation}\]
What \(\%\) of Commercial energy came from Electricity?
\[\begin{equation} \text{Percent}=\frac{4.69\text{ quads}}{9.57\text{ quads}}=\bbox[yellow]{49.0\text{%}} \end{equation}\]
Overall, what \(\%\) of US energy was wasted?
\[\begin{equation} \text{Percent}=\frac{67.3\text{ quads}}{100.3\text{ quads}}=\bbox[yellow]{67.1\text{%}} \end{equation}\]
What is the overall efficiency of the US energy System?
\[\begin{equation} \varepsilon=\frac{\text{Energy}_{\text{used}}}{\text{Energy}_{\text{input}}}=\frac{33.0\text{ quads}}{100.3\text{ quads}}=\bbox[yellow]{32.9\text{%}} \end{equation}\]
If you need more help in interpreting this flow diagram, this YouTube video may be helpful.
A similar, but slightly different diagram detailing US energy consumption is shown in Figure 5.4. Source energy (inputs) from the left-hand boxes must equal End-Use Sector (consumption) energy in the right-hand boxes. The Small values on the top of the energy flow lines are percentages (%) for the sources and sectors. They also sum to 100% for each fuel box or end-use sector box.

Figure 5.4: US Energy Information Administration. Source: https://www.eia.gov/energyexplained/us-energy-facts/
Additional questions can be asked and answered from the graphic above highlighting US energy consumption from source to sector. For example, it is noted that 27\(\%\) of Renewable Energy total on the source side makes up 9\(\%\) of Industrial Energy on the sector side. Simple math confirms that the source and sector energy along this line is equivalent.
Take the value of 12.2 quads for renewable energy on the left side and multiply this “primary energy” by the percent that goes to industrial energy (27%):
\[\begin{equation} 12.2\text{ quad} \times 0.19 = \bbox[yellow]{2.3 \text{ quad}} \end{equation}\]
On the right side, you can take the amount of industrial energy and multiply that by the 9 % from renewables:
\[\begin{equation} 25.9\text{ quad} \times 0.06 = \bbox[yellow]{2.3 \text{ quad}} \end{equation}\]
These 2 equations highlight their equivalency and the use of this type of diagram.
5.7 Energy Systems - Electricity Generation
The production of electricity is discussed next in some detail since this form of electrical energy dominates the lives of the majority of people on earth. Electricity is so ubiquitous that we think of it mainly when something goes wrong within the system that provides it to us so reliably. In later chapters on buildings and transportation we will discuss the more direct generation of energy and heat.
Most electricity at a large utility scale is generated from a steam turbine power plant which has already been mentioned. This type of energy system combusts fossil fuels of coal, natural gas, and oil (as well as renewable biomass) in order to generate steam. This steam spins a turbine system that converts kinetic energy to electricity which is distributed via transmission lines to businesses, farms, and households. The electrical switches and outlets in our houses and buildings are physically connected by conducting metal wires to an electrical grid system that starts with these steam power plants. Nuclear power plants are a variation of these steam plants, with the difference being that the heat is generated from the atomic splitting (fission) of a radioactive fuel rather than the combustion of a fuel.
A simple system flow diagram useful for both fossil and nuclear electricity generation systems is shown in figure 5.5. Such flow diagrams help to visualize and quantify the flow of energy in these systems. Given data about some elements in this system, the entire flow of energy throughout the system can be calculated. At the same time, diagrams like this hide much of the complexity and technical details that allow these systems to work reliably. Mining engineers extract the raw materials from the earth for the input fuels, mechanical engineers design turbine systems, electrical engineers design the electrical grid to carry the electricity, and so on.

Figure 5.5: Electrical power plant simple energy flow diagram
Energy systems are quantified by their efficiency to transform one form of energy to another. In the case of fossil fuel power plants, chemical energy in the fuel is combusted with oxygen to release energy in the form of heat to produce the steam which, in turn, spins a turbine to generate electricity. Energy in this case is transformed from one type to another and the efficiency of this transformation is important. Thermodynamics requires that all energy transformations are associated with the loss of some energy, and hence, we have no perpetual motion machines.
Efficiency, \(\varepsilon\), is defined in equation (5.4) as the output energy (or secondary energy) divided by the input energy (primary energy). Note that output energy here is defined as energy that is created intentionally for use. In the case of a power plant in the simple system diagram, the output energy is in the form of electricity on the right side of the power plant while the input energy is generally a fossil fuel on the left side. Energy is always lost going through a power plant or any type of energy transformation.
\[\begin{equation} \varepsilon=\frac{\text{output energy}}{input energy}=\frac{E_{out}}{E_{in}} \tag{5.4} \end{equation}\]
The efficiency of an energy system cannot be great than 1.0 which is equivalent to 100%. In words, you can’t get more energy out of system than you put in. In reality, the output energy from a system like a power plant is actually much less than 100% due to a variety of energy losses or inefficiencies. We have already seen from the Sankey diagram that on the order of two-thirds of primary energy is lost from the entire US energy system. In other words, roughly 32 Quads of energy were output from the 97 Quads of energy input and 65 Quads were wasted. The efficiency then from the equation is 32 Quads/97 Quads = 33\(\%\).
Efficiency is a powerful metric because using this factor one can easily calculated the output energy of a power plant given the amount of energy input to the system. Conversely, given an amount of electricity generated, one can use the efficiency to determine the amount of fuel required. With the efficiency equation, any of the factors can be calculated if the other two are known.
Here’s a simple example worked out using the equations for energy density and efficiency along with unit conversions.
Question: 1 million cubic feet of natural gas is input as primary energy into an electricity-generating power plant. If the volumetric energy density of natural gas is 1,049 Btu ft-3 and the efficiency of the power plant is 35\(\%\), how much output (or secondary) electricity (kWh) is generated?
Given:
\(\varepsilon\) = 35 \(\%\)
\(\rho\) = 1049 Btu ft-3
Find:
Esecondary
Solution:
Equation 1:
\[\begin{equation} \varepsilon_{\text{plant}}=\frac{\text{output energy}}{\text{input energy}}=\frac{E_{out}}{E_{in}} \end{equation}\]
Equation 2, rearranged from equation 1:
\[\begin{equation} E_{out}=E_{in}\times \varepsilon_{\text{plant}} \end{equation}\]
Equation 3:
\[\begin{equation} E_{in}=\rho_{\text{e,volume}}\times \text{V}_{\text{gas}} \end{equation}\]
Equation 4, replace Ein from equation 3 into equation 2:
\[\begin{equation} E_{out}= \rho_{\text{e,volume}}\times \text{V}_{\text{gas}} \times \varepsilon_{plant} \end{equation}\]
Plug in numbers:
\[\begin{equation} \text{E}_{\text{out}}=\left( 1\times 10^{6} \right)\times 1049 \frac{\text{BTU}}{\text{ft}^{3}}\times \frac{1 \text{kWh}}{3412\text{ BTU}}\times 0.35=\bbox[yellow]{1.08\times 10^{5}kWh} \end{equation}\]
Note, that simply converting the input fuel energy directly to kWh will not give the correct answer. The fuel is combusted in the plant and the associated loss of efficiency must be accounted for. In terms of the simple flow diagram, anytime you move energy from the input (primary) side of the power plant to the output (secondary) side of the plant, you must use the efficiency. The equation can also be used to inversely to calculate the required input energy if you are given the efficiency and the output energy. If you wanted to calculate the amount of energy that makes it to the consume, you would need to take into account the tranmission loss along power lines from the power plant to the house. Typical transmission losses are around 4\(\%\), thus \(\varepsilon\)trasmission = 1 - 0.04 = 0.96\(\%\). Practice doing these problems in both directions for mastery!
Energy systems often have a number of efficiencies associated with them which we will discuss throughout this text. In such cases, efficiencies can be multiplied together to obtain an overall system efficiency (equation (5.5). If you break any system into parts and calculate the output energy at each step using the individual efficiencies of each step, you can show mathematically that this is the same as calculating an overall system efficiency.
\[\begin{equation} \varepsilon_{total}=\varepsilon_{1}\times \varepsilon_{2}\times \varepsilon_{3}\times \cdots \varepsilon_{n} \tag{5.5} \end{equation}\]
Energy efficiency from a plant to your desklamp
The figure above shows the main energy losses from a power plant all the way to an incandescent light bulb in a residential house. This serves as a good example of considering multiple system efficiencies.
The efficiency of the power plant in this example is 38\(\%\), the transmission efficiency of the electric grid is 95\(\%\), and the incandescent light bulb efficiency of converting electricity to light is 5.6\(\%\). Note that the electric utility often reports grid loss rather the grid transmission efficiency. The transmission efficiency of an electrical grid is simply (1 – transmission loss). Also, the low efficiency of the incandescent bulb is due to all of the waste heat produced by heating a resistive metal filament with electricity which you likely know from experience if you have touched one of these bulbs when lit.
Multiplying these 3 system efficiencies together gives:
\[\begin{equation} \varepsilon_{\text{system}}=0.38\times0.95\times0.056=\bbox[yellow]{0.02=2\text{ %}} \end{equation}\]
This means that if 100 kWh of energy are input into this system for incandescent lighting, only 2\(\%\) of the energy ends up as light. This calculation can be confirmed by splitting the system up into parts. For the power plant, the efficiency is 38\(\%\) so 38 kWh exit the plant as secondary energy. Transmission of the electricity through the grid is 95\(\%\) efficiency so 38 kWh x 0.95 = 36 kWh. The light bulb is 5.6\(\%\) efficient so 36 kWh x 0.056 = 2.0 kWh. This confirms the total system efficiency as 2.0 kWh/100 kWh is 2.0\(\%\). Calculating the system efficiency step-by-step give insights into the intermediate steps, but takes longer to get to the same final answer.
It’s important to put energy analysis numbers into some context. 2\(\%\) efficiency means that 98\(\%\) of the input energy is lost in the process. Green engineering could potentially improve each of these inefficiencies – a more efficient power plant, a more efficient electrical transmission grid, or a more efficient light bulb. Light emitting diodes (LEDs) are much more efficient than incandescent light for producing desired light instead of unwanted heat. Approximately 85\(\%\) less energy is required for an LED to produce the equivalent light output of an incandescent light. While this technology significantly increases the third energy efficiency term in the example above, the LED light doesn’t improve either the transmission efficiency or power plant efficiency. Using the numbers above, electricity entering any house is already only 0.38*0.95 = 36\(\%\) efficient before it gets to the light bulb or any other electrical appliance or device.
The efficiency of these thermal energy systems is governed by the laws of thermodynamics meaning there is a maximum theoretical efficiency in these systems. A typical coal-fired power plant efficiency is approximately 35\(\%\). This means that approximately two-thirds of the fuel input energy is not converted into electricity. This energy is primarily lost as heat and is mostly independent of the fuel source.
Cogeneration, also known as co-gen, combined heat and power (CHP), or combined cycle (CC)systems produce electricity from a steam plant and also capture and use some of the heat which is normally lost. CHP plants have efficiencies in the 45 – 60\(\%\) range depending on the fuel source and technology. The VT campus power plant is a co-gen plant so it has the potential to have a higher efficiency than the electricity that is purchased from a utility. In this campus example, some of the heated steam is circulated through campus for heating purposes. There are also new, advanced Integrated Gasification Combined Cycle (IGCC) systems which have even higher efficiencies.
The Capacity of a power plant is a technical specification which refers specifically to the amount of power that it is rated by the manufacturer to provide. A 500 megawatt (MW) power plant, under typical conditions, provides up to this amount of power instantaneously. Recall, the energy generated by the plant is the power multiplied by the time at this power. For energy estimates, the power generation is considered a constant to simplify the calculation. While energy and power are often interchanged in everyday use of these words, these terms are very specifically defined in an engineering context and using them loosely or interchangeably will lead to mistakes in energy calculations.
Look at the figure of US Power Plants capacity by energy source and the year the power plant was put into service. Look carefully at the figure and note some of the trends regarding the time frame of the various energy sources.
Questions:
-
What trends jump out to you?
-
Can you think of reasons to explain these trends?
-
What might be some of the implications of this information for the future?

Figure 5.6: This figure shows the capacity of US Power Plants by energy source and the year the plant was put into service. Question - What trends do you see with nuclear, natural gas, and renewable energy power plants?
The Washington Post article, Mapping How the United States Generates its Electricity which was updated March 28, 2017, is an excellent overview article detailing the different types of electricity-generating systems in the US. Figure 5.7 is just one of the many detailed grapics in this article. It shows a color-coded map of all US energy plants by size and fuel. Some of the other graphics in this article highlight particular types of fuel sources to make the geographic information and plant sizes a bit easier to focus on.

Figure 5.7: Plant Capacity by power source. From the Washington Post.
Look at the map from the Washington Post article.
Questions:
-
What interesting trends can you see from the color-coded map?
-
Can you explain some of these trends?
-
What might be some of the implications of this information for the future?
Another key power plant metric with a similar name, but a different meaning is the Capacity Factor (CF). The CF is a measure of the utilization of a power plant over time. Fossil fuel and nuclear plants have maintenance and other downtime which limit their potential production of energy. The capacity factor is defined as the total electrical energy produced by a power system divided by the energy that could have been produced if the power plant was running continuously at its rated capacity (power) as shown in equation (5.6).
\[\begin{equation} CF=\frac{\text{Actual energy produced }\left[ \text{MWh} \right]}{\text{Rated energy potential}\left[ \text{MWh} \right]}=\frac{E_{actual}}{E_{rated}}=\frac{P_{actual}\times \text{T}_{\text{actual time plant operational}}}{P_{rated}\times\text{T}_{\text{total time in time period}}}<1.0=100\text{%} \tag{5.6} \end{equation}\]
It’s important to note that the capacity factor is completely dependent on the running time of the power plant and independent of its efficiency. Conversely, efficiency is only dependent on the input and output energy and not the time for energy production. It’s also unfortunate that the terms capacity and capacity factor have different units and definitions as this leads to confusion and mistakes.
A benefit of the capacity factor definition is that the actual energy production for a system can quickly be estimated for any period of time given the capacity (rated power) of a plant and its capacity factor which can be estimated or looked up. Rearranging equation (5.6) and substituting in the equation for energy gives equation (5.7) for actual energy production of a power plant, E actual. In most cases, a time frame (t)of 1 year is used to estimate annual energy production.
\[\begin{equation} \text{E}_{\text{actual}}=\text{E}_{\text{rated}}\times \text{CF}=\text{P}_{\text{rated}}\times t \times \text{CF} \tag{5.7} \end{equation}\]
You will notice that this energy is linear with time due to the assumption of constant power(rated power) from an energy system. Fossil fuel and nuclear power plants are tightly regulated energy systems so their power is maintained more or less constant due to the control of the fuel input and process parameters. Therefore, assuming the power plants run at full rated power is a good assumption for estimating energy production over time. Engineers working in these fields use more detailed equations and models which consider additional factors. For our purposes, these calculations will get us within 10% of the energy production which is sufficient for higher level discussions and decisions.
The Capacity Factor of a well-maintained baseline fossil fuel plant can be above 90% and is controlled primarily by maintenance issues. Fossil fuel power plants typically operate close to their listed capacity except for short start up and shut down periods. In figure 5.8 which shows historical trends for the capacity factors of different energy source, note that coal and natural gas power plants are running at much lower capacity factors. For coal plants, this is primarily an issue of maintenance downtime as these plants are relatively old (see previous figure 5.6) and near the end of their designed lifetime. In contrast, natural gas plants are often designed as “peaking” plants which means they are offline when energy demand is low but can be turned on relatively quickly, often in less than an hour, as energy demands peaks. This is more common in highly populated and hot climate regions like California in the summer afternoons when air conditioning needs rise beyond typical energy production. Coal plants take much longer to start up and shut down, like a day, so are better used as baseline energy sources. Nuclear plants can take even longer to start up based on the higher safety issues and additional maintenance associated with the radioactive fuel. Because of better maintenance, nuclear plants have higher capacity factors above 90%.
For renewable energy systems like solar and wind, the assumption of constant power generation is not valid due to changing sun and wind input over time. We will see in the next chapter that the capacity factor for these systems must take this into account to be accurate. Overall, wind and solar capacity factors are in the 30 – 40\(\%\) range which is a serious limitation that needs to be considered for integrating these into the electrical distribution grid.

Figure 5.8: Capacity factor vs. time for energy system sources (Benchmarking Air Emissions of the 100 Largest Electric Power Producers in the US, 2022.)
Here’s another simple example worked out using the capacity factor.
__Question–: How much energy (MWh) can be produced in a year by a 1000 MW fossil fuel power plant running at 85\(\%\) capacity factor?
Given:
P_rated_ = rated power of powerplant, or name-plate capacity = 1000 MW
CF = 85\(\%\)
1 year = 365 days x 24hrs/day = 8640 hours per year
Solution:
Equation 1:
\[\begin{equation} \text{CF}= \frac{\text{E}_{\text{actual}}}{\text{E}_{\text{rated}}} \end{equation}\]
Equation 2, rearranged from equation 1:
\[\begin{equation} \text{E}_{\text{actual}} = \text{E}_{\text{rated}} \times \text{CF} \end{equation}\]
Equation 3, substitute E = P x t into equation 2:
\[\begin{equation} \text{E}_{\text{actual}} =\text{P}_{\text{rated}} \times t \times \text{CF} \end{equation}\]
Finally, plug in numbers:
\[\begin{equation} \text{E}_{\text{actual}} =\text{1000 MW} \times 8640\frac{hr}{yr} \times \text{0.85}=\bbox[yellow] {7.45\times 10^{6}\text{ MWh }yr^{-1}} \end{equation}\]
Following these methodical steps provides the opportunity to follow the logic easily and identify errors. Within this course, these steps are expected to instill good habits in your workflow and documentation.
Note that the time units need to be considered carefully to get the correct energy units for the answer.
To practice your comfort level with these concept, ansewr the following using a complete equation where you explicitly cancel out units in a step by step approach:
On the way to a meeting in your car, you get stuck at a railroad crossing due to a coal train. You are bored, and the first car in line, so you start counting coal cars which look to be full. You count 125 cars for this train.
-
Estimate the total energy (BTU/train) transported by this coal train? Assume an average coal car can hold 120 tons of coal and the density of the coal is 19.5 million BTU/short ton.
-
How much electricity (kWh) could the coal in this train produce in a 500 MW coal plant running with a capacity factor of 85% and an efficiency of 35%? (Conversion factor: 1 kWh = 3413 Btu)
-
How many full trains of coal are required to supply the Coal Plant with enough fuel to run for the year?
5.8 Life Cycle and Triple Bottom Line Considerations for Energy Systems
Circling back to the concept of life cycle phases, energy systems have Extraction, Manfacturing, Use, and Disposal to consider. This is shown schematically in Figure 5.9. The discussion of the TBL for fossil fuels is the subject of an entire book but we can highlight some of the main issues and encourage you to do additional reading and research on your own.
For fossil and nuclear fuel power plants, the raw materials need to be mined (extraction) and transported for refining (manufacturing phase) into their final fuel form. The use phase is the combustion/fission of the fuel to generate the steam to drive the electricity-generating turbines. It is this stage which produces significant air emissions which have climate, health, and ecosystem impacts. The electricity itself has no disposal phase when it is used to run the ubiquitous equipment and devices of our society, but there are disposal issues earlier in the life cycle. Mining of fuels leaves behind mining waste and damages ecosystems due to deforestation, excavation, and accidents. We have all seen news reports of oil leaks from wells, pipelines, and transportation vehicles. As a gas, natural gas does not typically contaminate the soil or water but is more likely to explode due to leaks in infrastructure. Coal has contaminants that do not combust fully so approximately 10\(/%\) of its input mass ends up as coal ash which contains toxic heavy metals which is often buried or stored in ponds near power plants. For scale, approximately 60 – 70 million tons of coal ash was disposed in recent years but there have been some advances in technology for the reuse of more than 50\(\%\) of this waste product in concrete, bricks, wallboard, and roofing products.

Figure 5.9: Life Cycle Power Plant Schematic. From Meldrum, James R., et al., Life Cycle Water Use for Electricity Generation: Implications of the Distribution of Collected Estimates. ASME Power Conference. Vol. 56062. American Society of Mechanical Engineers, 2013.
Nuclear fuels have the added impacts of radioactivity requiring careful handling to prevent health hazards during mining and fuel processing. During the fission process to generate energy, the fuel creates other radioactive waste byproducts which need to be handled and then stored for thousands of years. Nuclear power plant accidents, while rare, have the potential to contaminate a large area of land for hundreds of years or longer as has happened in Chernobyl, Russia, and Fukishima, Japan.
Associated with the generation of electricity are greenhouse gas (GHG) and other air emissions due to the combustion chemistry equations shown below. These are simplified as the fuel burned in power plants and vehicles are not pure and there are other reactions. For example, coal has low levels of sulfur and mercury which are emitted to the atmosphere as sulfur dioxide which causes acid rain and mercury which is precipitated into lakes and oceans where it bioaccumulates in birds and fish.
All of the carbon-based fossil fuels necessarily form carbon dioxide, water, and heat when combusted. There is no way to avoid carbon dioxide emissions when any carbon-based fuel is burned. Since power plant combustion is done with air which is approximately 78\(\%\) nitrogen and 21\(\%\) oxygen, the nitrogen oxides which necessarily form and cause additional air pollution are not shown in the equations.
\[\begin{equation} \text{Coal}:C+O_{2}\to CO_{2} \end{equation}\]
\[\begin{equation} \text{Natural Gas}:CH_{4}+2O_{2}\to CO_{2}+2H_{2}O \end{equation}\]
\[\begin{equation} \text{Gasoline}:C_{8}H_{18}+12.5O_{2}\to 8CO_{2}+9H_{2}O \end{equation}\]
Greenhouse gases (GHGs) may be familiar to you from the news, but it’s worth a quick summary of their impacts and additional research if you are interested or confused by this important topic. Certain chemicals by nature of their elements and bonding structure can absorb energy. GHGs accumulate in the earth’s atmosphere act like a greenhouse which lets energy (visible light) into the system but then absorbs thermal energy rather than letting it escape thereby causing warming as energy input is greater than energy output. Only a relatively small number of all chemicals act as GHGs, but the list includes carbon dioxide, methane, nitrous oxide and water. Each GHG has a Global Warming Potential,GWP) which is just a relative measure of the amount of warming that the chemical can absorb over its lifetime in the atmosphere. Carbon dioxide, as the dominant GHG in the atmosphere contributing approximately 75\(\%\), is used as the baseline GHG and given a value of 1.0. Water vapor in the atmosphere is mostly in equilibrium due to the water cycle, but the amount of carbon dioxide and methane is increasing in the atmosphere due to the emissions of these chemicals due to fossil fuel use. This is a primary cause for global warming.
The use phase emissions from power plants dominate the emissions of carbon dioxide across the whole life cycle, though there are much smaller emissions associated with extraction and refining of the fuels. Methane emissions, on the other hand, arise from leakage during mining and transportation of this gaseous fuel. Power plants report their use phase emissions as carbon dioxide emissions factors. The units are often the mass of CO2 per kWh generated and in this case they are based on the secondary energy output of the power plant. Sometimes, carbon dioxide emissions plus all of the minor GHG chemicals are included in this analysis to produce an overall GHG emission factor. In this case, the units are mass of CO2e, where the e stands for equivalent, per kWh. Since CO2 dominates the emissions of GHG, the CO2e value is only slightly higher than the CO2/kWh value. This type of emission factor is most useful when the energy use is known.
Given a carbon emissions factor (kg CO2/kWh)for a specific power plant or a utility system consisting of a number of power plants, designated as fCO2 in equation (5.8), then the total GHG emissions (kg CO2) are determined by simply multiplying this factor by the amount of electricity generated (kWh).
\[\begin{equation} m_{\text{CO}_{2}}=f_{\text{CO}_{2}}\times E_{out} \tag{5.8} \end{equation}\]
Transmission losses can make emissions calculations slightly more complicated. For a given amount of electricity used by a consumer, the amount generated at the power plant must be slightly higher due to the transmission efficiency. The efficiency equations discussed earlier are used to back calculate the secondary energy generated at the power plant and then used to estimate emissions.
Note that in some cases power plants carbon dioxide emissions factors will be reported in units of mass of CO2/mass or volume of fuel - for example, tons CO2/ton coal or tons CO2/ft3 of natural gas. Power plants provide the data with these units based on measurements of the GHG emissions at the plant and the input fuel amounts. If you have this type of carbon emission factor, replace Eout with Eprimary in equation (5.8).
Another detail to look out for is the reporting of emissions factors in terms of carbon rather than carbon dioxide. Going back to your high-school or college-chemistry and recalling the periodic table, you’ll recall that carbon has an atomic mass of 12 grams/mole while CO2 has a molecular mass of 44 grams/mole (one unit of carbon at 12grams/mole and 2 units of oxygen at 16g/mole each), the conversion between these different units is a factor of 44/12 = 3.67 grams CO2/gram C.
The air emissions from the electricity sector over the past 2 decades are shown in Figure 5.10 along with the changes in the fuel mix for generating this electricity. As coal use has decreased and natural gas and renewable sources increased in the past decade, the overall carbon dioxide, nitrogen oxides, and sulfur oxide emissions associated with the electricity grid in the US have decreased.

Figure 5.10: Benchmarking Air Emissions of the 100 Largest Electric Power Producers in the US, 2022. Source: https://hohoho.sustainability.com/globalassets/insights/benchmarking/benchmarking-air-emissions-2023.pdf
Carbon dioxide Emissions factor for coal, natural gas, oil and a few other fuels are shown below, all normalized to the same amount of primary energy for a true comparison. Note that these values are for just the use phase (combustion) of the fuel. The total emissions values can change significantly when the entire life cycle of an energy system is considered. For example, the leakage of methane across its life cycle increases the GHG emissions for natural gas due to its large global warming potential.
| Fuel Source | lbs CO2 emitted per MMBTU (primary energy) | |
|---|---|---|
| Anthracite | 228.6 | |
| Bituminous coal | 205.6 | |
| Sub-Bituminous coal | 216.4 | |
| Lignite | 215.4 | |
| Diesel fuel / heating fuel | 163.5 | |
| Gasoline | 156.8 | |
| Propane | 138.6 | |
| Natural gas | 116.7 |
Sources: EIA
Exercise: Confirm that coal (anthracite) emits approximately 1.1 kg CO2/kWh of secondary energy using the primary carbon emissions factor for the table above and assuming the power plant efficiency is 33\(\%\).
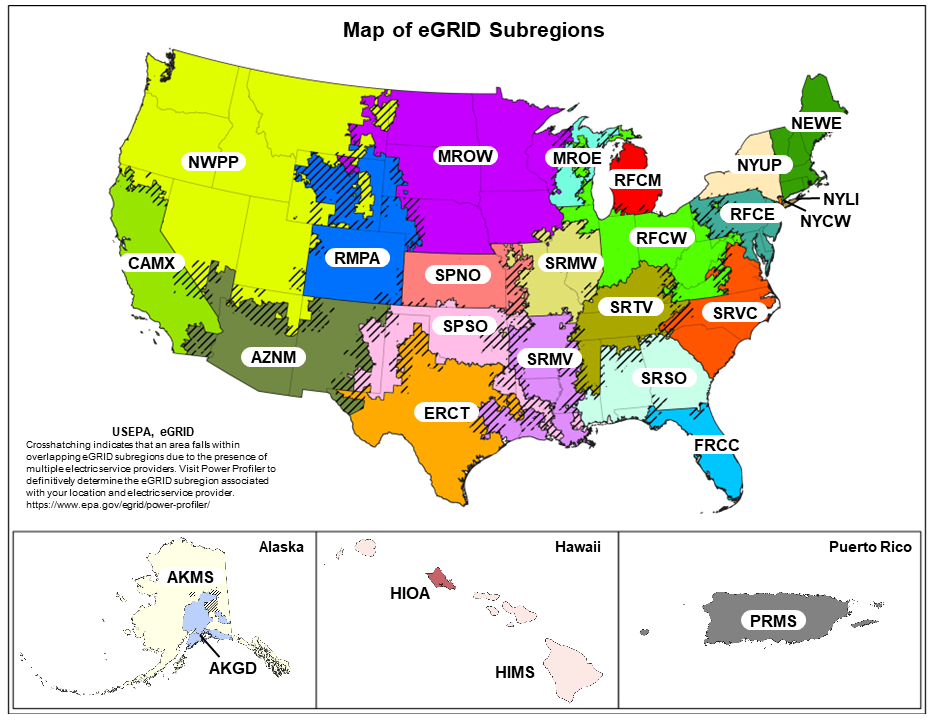
The US grid is comprised of 27 sub-regional grids (5.11) which are mostly interconnected to exchange electricity. Energy supply and demand change by the minute throughout the day and must be balanced. Given the grid’s limited storage capacity for electricity, they must work together to efficiently transmit the electricity where it is needed otherwise blackouts can occur. These grids are shown on the map in figure 5.11 and Figure 5.12 and 5.13 detail the capacity, electricity generation, emissions, grid losses and other factors for the subgrids from the EPA eGrid website. Scan these emissions tables to see the significant differences between the various subgrids.

Figure 5.11: Regional electric grids across the US. Source: https://www.epa.gov/system/files/images/2024-05/egrid-subregion-map.png

Figure 5.12: eGRID Subregion Total Output Emission Rates (lb/MWh). The online source provides ability to look at any eGRID subregion. Source: https://www.epa.gov/egrid/summary-data

Figure 5.13: Subregional resource mix. In other words, this table tells you what type of energy source sources power your house. Complete data can be found here: https://www.epa.gov/egrid/power-profiler#/
5.8.1 Energy Costs and Return on Investment
The cost of electricity to the consumer depends on the costs throughout this lifecycle. Utilities pass along all the life cycle costs for operating a power plant including the fuel, maintenance, grid equipment, electricity transmission, permits, employee labor, etc. Large utilities which are private corporations also add on a profit for their investors. In many states, the prices that they charge to customers which vary for residential, commercial, and industrial customers must be approved by a state utility commission since utilities often are monopolies with few or no other competitors. Electricity costs are complex and vary both regionally and locally and we only have time to touch on a few of the basic concepts and methods for simple cost estimations.
The cost factor for electricity per unit energy, ce, is generally available in dollars per electricity consumed ($/kWh) as measured by electrical meters. You might have seen an electricity bill for your apartment or home which includes this value. Multiplying this cost by the electricity consumption, as in equation (5.9), gives the total cost. The energy consumed and measured at the meter of a house, business, or equipment is less than the output energy at the power plant due to transmission losses as we have discussed with the light bulb example. Often, there are other costs on an electricity bill for distribution services, taxes, and maybe even peak power or demand charges in some states that add onto the the total electricity cost.
\[\begin{equation} \text{Cost [\$]}=\text{c}_{e}\text{ }\left[\frac{$}{kWh} \right]\times E_{\text{purchased or consumed at the meter}} \tag{5.9} \end{equation}\]
where Econsumed is measured at the meter box of the house/building using the electricity.
Return on Investment (ROI) is a common term in business to indicate the amount of money you earn on money that has been invested. It allows for different types of investments to be compared on the same basis for decision making. Deals with higher ROI are more profitable for investors. Energy Return on Investment (EROI) is a similar concept which allows comparison of different energy sources based on energy inputs and outputs. This has important implications for energy policy and decision-making, as it impacts the overall cost and sustainability of energy systems. From an economic perspective, governments and citizens should typically choose the highest EROI projects if all other factors are equal.
EROI is defined as the ratio of the usable energy that can be extracted from a particular energy source compared to the amount of energy required to extract, process, and distribute that energy source across its life cycle as shown in equation (5.10). The value is unitless and looks a lot like the standard efficiency equation introduced earlier in this chapter, the difference being that the energy terms are compiled across the entire life cycle.
\[\begin{equation} \text{EROI}=\frac{\text{E}_{\text{out, lifecycle}}}{\text{E}_{\text{in, lifecycle}}} \tag{5.10} \end{equation}\]
Higher EROI indicates a more energy-efficient system, while lower value suggests that more energy is being invested in the energy-production process than is ultimately gained from the produced energy. If the EROI is less than 1, then more energy is required to be input to the system than is obtained for use which is not a sustainable option.
For fossil fuels, EROI was historically very high for resources when they were plentiful and easy to acquire as was the case when oil was first discovered in Pennsylvania and Texas in the 1860s. As oil supplies have been depleted, new oil fields are typically much deeper and more difficult to mine which decreases the EROI due to additional extraction energy demands for the same amount of oil. The EROI of different energy sources changes over time due to technological advancements, changes in resource availability, and shifts in market conditions. Fossil fuel EROI values typically decrease over time due to depletion. However, the EROI of shale natural gas has increased in recent years due to advances in hydraulic fracturing technology which have lowered costs to get this resource. Environmental concerns and increased regulations can also affect EROI if regulations require more energy, for example, for additional remediation of mining sites.
Current EROI estimates have hydroelectric power and nuclear power with the highest EROIs in the range of 30 to 100. EROI estimates for wind power range from 18 to 50. These ranges indicate the accuracy and difficulty of the measurement. Solar and biomass energy have lower EROIs, with estimates ranging from 2.5 to 10 depending on the specific technology and location. These values are expected to increase with time as the efficiency of solar panels and biofuel processing increases. The EROI for oil is estimated to be between 4 and 30, depending on the specific location and type of oil. Natural gas has a somewhat higher EROI than oil, with estimates ranging from 20 to 40.
A significant challenge in defining and measuring EROI is where to draw the boundaries in the life cycle schematic when adding up all the life cycle energy inputs, especially for different technologies that have very different upstream activities associated with them. An older Scientific American article on this topic (Inman (2013)) including the challenge of these calculations is fascinating even though the actual EROI values listed there are a bit out of date.
Consider 1 ton of coal input to a power plant given the following additional parameters and assumptions. This coal input will be on the left hand-side of the system diagram and represents the primary energy.
Given
Mass = 1 ton coal
Coal energy density = 20 million BTU/ton
1 kWh = 3412 BTU (energy conversion)
1 ton = 2000 lbs. (US short ton, slightly different value from metric tonne)
Questions
-
How much electricity (kWh) can be produced for the electrical grid from 1 ton of coal?
-
If this plant has a capacity of 500 MW, how much energy (kWh) can it produced in a year if the capacity factor is 85 percent?
-
How much carbon dioxide (tons) is emitted to the atmosphere from the RFCW regional electricity grid which supplies the Blacksburg region? Use the carbon emissions factor for this subregion from eGRID Subregion Total Output Emission Rates table?
-
How much does this electricity cost ($) residential consumers in Virginia? Use Table 5.6.A. in the following document Average Price of Electricity to Ultimate Customers by End-Use Sector from the Energy Information Administration?
5.8.2 Environmental Justice & Energy Equity
The best Green Engineering solutions help society stay within our planetary boundaries as discussed in the last chapter. These solutions must also be economically viable with reasonable ROI for investors to finance new technologies. The TBL also means that we need to deal with shortfalls in human well-being on the inside of the donut which includes the concept of environmental justice? Within the Code Ethics for Engineering, the following is stated:
“Engineering is an important and learned profession. As members of this profession, engineers are expected to exhibit the highest standards of honesty and integrity. Engineering has a direct and vital impact on the quality of life for all people. Accordingly, the services provided by engineers require honesty, impartiality, fairness, and equity, and must be dedicated to the protection of the public health, safety, and welfare. Engineers must perform under a standard of professional behavior that requires adherence to the highest principles of ethical conduct.”
— Code Ethics for Engineering
These words include “for all people”, fairness, and equity. Thus, our ethical obligations require us to consider the impacts of our design/lifetime of a product on all people affected. Within this context, it is also imperative that no one subset of a population is disproportionately impacted. One objective in this text is to simply start a conversation to build awareness regarding environmental justice which is often hidden from those not affected. We do not pretend to have the answers, and are considering these difficult issues right along side all of you.
In addition to the Code of Ethics, each of our ABET accredited engineering programs at Virginia Tech (and other US universities) have student outcomes which define the skills that students have when they graduate. One of the ABET student outcomes is the following:
and make informed judgments, which must consider the impact of engineering solutions in
global, economic, environmental, and societal contexts.
With these aspects in mind, we believe it is our responsibility to bring Environmental Justice into our course to prepare you for your careers and a sustainable future. There may be some of you that may wonder if we are pushing a political agenda. Our intent here is not about presenting a political agenda, although some of the topics that we cover have become political in nature. We will discuss environmental justice in the context of balancing the complicated issues of triple bottom line and the donut. Let the conversation begin.
Environmental Justice is one shortfall that has disproportionately impacted minority groups across the US. So what is Environmental Justice? The simplest definition for Environmental Justice and Energy Equity that has been adopted by the DOE is shown below: > “Environmental justice is the recognition and remediation of the disproportionally high and adverse human health or environmental effects on underserved communities.”
Energy equity (see link here) recognizes that disadvantaged communities have been historically marginalized and overburdened by pollution, underinvestment in clean energy infrastructure, and lack of access to energy efficient housing and transportation.
Today, there are still communities across the US that are disproportionately affected by non-renewable energy and other fundamentals for human well-being. In this class, we’ll bring in issues related to energy, food and water, along with approaches to address ongoing inequities. For example, the EERE office within the Department of Energy (Office of Energy Efficiency and Renewable Energy) is now prioritizing explicit access to afforable ‘clean energy’ to underserved communities.
One available tool from the EPA to explore Environmental Justice issues is through a spatial mapping screening tool EJScreen that maps air quality and other hazards along with socioeconomic indicators, health disparaties, and other metrics. The intended use of this tool is for screening where there may be environmental justice concerns, providing an opportunity for a closer review.
Can you think of an environmental justice issue in your home town or nearby city? Why do environmental justice issues exist? What is our responsibility as an engineer and in our own individual lives? We’ll begin talking about these throughout the course this semester.
One of the primary tenants of the Environmental Justice Movement:
Here, we are talking about giving voice and agency to communities. In the energy field, an example is the siting for a large infrastructure project like a pipeline. For example, the Atlantic Coast Pipeline was a planned 600-mile pipeline to transport natural gas from West Virginia to North Carolina. The proposed route was shown to disproportionately impact minority communities and the Lumbee tribe. While the Federal Energy Regulatory Commission (FERC) initially approved the route, advocates of the Lumbee Nation and other communities worked to highlight the environmental justice concerns related to the project, and ultimately the project was cancelled in July 2020. Dr. Ryan Emanuel, a professor at Duke University, was critical in researching and explaining how the proposed route would impact these communities – to learn more about the story, he’s given many interviews through the printed media and podcasts about the experience.